1. INTRODUCTION
1.1. Background
The digital industry was initially perceived as a new wave of industry that underwent constant changes in response to the dynamics of technology. The information and communications technology industry’s expansion shaped the definition and scope of the digital sector. As for the promotion of the digital economy, the definition of this type of industry is quite broad and includes various manufacturing and service industries that involve digital technology or the use of digital technology. Five main categories divide the digital industry: a) the hardware and smart device industry; b) the software and software service industry; c) the digital service industry; d) the digital content industry; and e) telecommunications. Even the overall view of Thailand’s digital industry has continued to grow every year, but there are still limitations to growth. Small and medium-sized entrepreneurs lack the capital to expand their businesses and cannot easily apply for a loan because the majority of digital businesses are considered too high-risk for banks to accept. Furthermore, the industry struggled to invest in innovation for high-value products and services, especially the linkage of digital research and development to the industrial sectors (depa, n.d.).
1.2. Digital Industry Context in Thailand
The digital industry job market must prioritize hiring individuals who meet the digital competency framework. These individuals must be knowledgeable, skilled, and capable of using digital technology effectively, appropriately, safely, creatively, ethically, and with freedom, aligning with the digital competency framework for Thai citizens in the twenty-first century. In this era, citizens must have the knowledge and capacity to survive the rapid changes, including a digital competency framework for future careers. In the Thai context, this phenomenon necessitates that citizens possess functional and hard skills that align with digital competencies and understanding. These skills include problem-solving with digital tools and adapting to digital transformations locally and internationally. In 2017, the United Nations Educational, Scientific and Cultural Organization compiled and analyzed a digital competency framework to establish guidelines for developing and educating digital citizenship. This led to introducing a digital competency framework, a digital curriculum, and digital education outcomes from leading organizations, all aimed at assessing and enhancing digital competencies for global digital citizens. However, companies in the industrial business sector can benefit from this framework. The human resource development and the human resource management sections of industrial businesses can apply the competency framework as a guideline for developing employees’ competencies and skills, enabling them to achieve the desired competencies. Employers can use the competency framework to select and evaluate employee qualifications (BDE Digital Competence Test, n.d.). Therefore, the competency framework is an essential factor in studying the needs of the digital industry job market. The data can be analyzed to find trends and needs for future workforce requirements in the digital industry. This will help workers about to enter the job market in this area to prepare.
1.3. Problem Statement
We employed data analysis processes to predict future workforce requirements in the digital industry. These processes analyzed past and present data to identify trends in specific competency requirements necessary to meet the needs of the digital industry business sector. Artificial intelligence (AI) techniques can develop a predictive model as a statistical model to analyze data for forecasting efficiently. Generally, computer programs process data analysis for prediction through machine learning from big data, making it more precise and accurate than traditional workforce planning methods.
1.4. Previous Studies and Techniques
This study employed the k-nearest neighbor (KNN) technique (Okoye et al., 2024), a supervised learning technique, to predict graduation and measure the model performance by determining accuracy, precision, recall, and F1-score. Studies by Alnuaimi and Tabbara (2023) and Tadla et al. (2023) employed the decision tree technique to create a predictive model for sustainable careers. The results showed that we can use the machine learning process to predict careers, allocate human resources, and plan for a sustainable workforce. Next, the study by Khalaf et al. (2023) employed logistic regression techniques to analyze the decline and growth of careers, revealing important characteristics for career prediction and future career changes. Research by Rajath and Pandita (2022) employed logistic regression techniques to predict absenteeism for workforce planning and overtime cost reduction. The studies of Arromrit et al. (2023) and Chakraborty et al. (2021) also used the Naïve Bayes method to create a model that could predict when an employee would quit. This helped researchers figure out what causes people to quit, such as the chance of job changes, so they could plan and measure ways to keep employees from quitting in the future. Additionally, machine learning techniques, such as Random Forest, Adaboost, XGBoost, Support Vector Machines, and Gradient Boosting, are highly effective in creating prediction models from big data to analyze human resource needs in organizations. The work by Puknilchai (2014) includes related factors, as does research by Gopinath and Appavu alias Balamurugan (2023), Lee et al. (2023), and Percia David et al. (2023). A predictive model has been developed to examine the needs for a suitable workload in the workforce. The results conclude that the number of human resources with appropriate proportions according to the workload still lacks prediction of organizational needs in other areas, such as specific job qualifications, skills, and abilities.
In addition to serving as a tool for forecasting future employment trends, predictive modeling is critical in guiding career development and aligning educational outcomes with labor market demands. Palee (2020) examined the concept of digital professional competency and proposed a career prediction model to prepare graduates for the evolving digital workforce. The findings indicated that students predominantly aspired to careers in four areas: content and design, technology services, business services, and product development—fields that align closely with the competencies expected of digital professionals. However, the study’s scope was limited to these specific digital careers and did not address all five key sectors of the broader digital industry. To achieve comprehensive and reliable forecasting, it is essential to incorporate detailed labor market data across diverse occupational domains. This is crucial for executive decision-making, as accurate workforce predictions inform strategic planning, operational alignment, and supply chain forecasting (Bunsongkha, 2018). Accordingly, the present study aims to develop a predictive model to estimate future workforce requirements across the digital industry and to identify emerging trends in human resource demand within this sector.
2. OBJECTIVE
3. METHODOLOGY
This study employs a research methodology focused on developing a predictive model to forecast future workforce requirements in Thailand’s digital industry. The methodology involved several key stages, beginning with the collection of job data through web scraping from various job advertisement websites. After gathering the data, natural language processing (NLP) techniques, such as text cleaning, tokenization, and stop word removal, were applied to prepare it for further analysis. The textual data was then transformed into a format suitable for model training using feature extraction techniques such as term frequency-inverse document frequency (TF-IDF). Various supervised learning models, including logistic regression, decision tree, KNN, and Naïve Bayes, were applied to build the predictive model. These models were evaluated using metrics such as accuracy, precision, recall, and F1-score to determine the best-performing model. The research methodology is illustrated in Fig. 1.
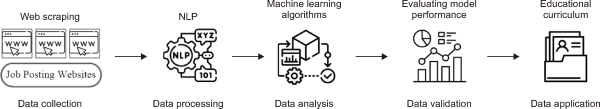
Fig. 1 is a framework that illustrates a systematic data pipeline for developing an educational application through five sequential phases. The process is initiated with web scraping-based data collection from job posting websites, suggesting a focus on labor market analytics. Subsequently, NLP techniques are employed to structure and clean the gathered information.
The data analysis phase incorporates machine learning algorithms to extract meaningful patterns and insights. The framework then progresses to data validation, where model performance is evaluated through metrics and statistical analysis to ensure reliability and accuracy. The final phase, data application, culminates in an educational curriculum or learning content, indicating the framework’s ultimate goal of translating labor market data into educational outcomes.
This sequential methodology framework demonstrates an evidence-based approach to curriculum development. It leverages contemporary data science techniques to align educational content with real-world employment demands. The framework represents a holistic integration of web technologies, AI, and educational design principles.
3.1. Data Collection
The data collection was conducted on ten job advertisement and job recruitment websites in Thailand, with the following selection criteria: 1) The website featured job positions in the digital industry across five categories, including hardware and smart devices, software and services, digital services, digital content, and telecommunication; 2) It was dependable and verifiable; and 3) The data on the website was current and consistently displayed new job opportunities throughout the data collection period. To ensure methodological rigor in the data collection process, we implemented the following measures: defining the scope and data sources, planning and designing data collection, validating data accuracy, managing missing or duplicate data, ensuring ethical and legal compliance, and maintaining reproducibility. In this study, we selected data from job positions from 2023 to 2024 using a text mining process (Chansanama & Tuamsuk, 2020), web scraping, and extracting information from a large amount of data (Monika et al., 2024). We also conducted commands in Python using the “Beautiful Soup library” (Abodayeh et al., 2023), which is a web scraping library for extracting data from HTML and XML documents from Google Colab. Web display programs can write and execute these commands, extracting information as text on the target web page. Then, as shown in Table 1, we exported the data in plain text for 24,494 positions in CSV file format.
Table 1
Descriptive attributes of job postings data
| No | Filed | Description |
|---|---|---|
| 1 | JobTitle | The specific title of the job being offered, clearly indicating the role, such as software engineer, project manager, or digital marketing specialist. This helps applicants understand the exact nature of the position being advertised |
| 2 | JobRequirements | A detailed list of the qualifications and skills necessary for the job. This could include technical skills, years of experience in a particular field, or additional competencies specified by the company, such as proficiency in specific software tools or fluency in a foreign language like English |
| 3 | JobWebsite | The domain or website where the job listing is posted. It provides a source where applicants can visit to explore more detailed information about the job position or the company itself |
| 4 | JobLabel | The classification indicates the specific category within the digital industry that the job belongs to. Includes 5 groups |
| 5 | JobDate | The date when a job post was published |
To ensure methodological rigor, data collection followed a structured process, including defining selection criteria, validating data accuracy through cross-checking with multiple job sources, and managing missing data using imputation techniques. Data integrity was maintained by removing duplicate records and standardizing job titles across different postings. These preprocessing steps were implemented using Python libraries such as “Pandas” and “NumPy” to enhance data reliability for subsequent analysis.
The job advertisements analyzed in this study predominantly represent workforce demand at the entry to mid-career levels, typically targeting recent graduates and professionals with up to ten years of experience. These roles constitute the majority of postings on recruitment platforms within Thailand’s digital industry, reflecting the current labor market’s emphasis on early-career talent acquisition.
3.2. Data Processing
NLP is a process that enables computers to interpret and understand the language used in human communication, with the aim of analyzing and extracting knowledge from large datasets (Rubio-Martín et al., 2024; SCB 10X, 2023). In this study, the NLP process involved the following crucial steps:
3.2.1. Text Cleaning
Text cleaning is the process of checking basic information to reduce errors, such as deleting redundant and unrelated words, correcting mistakes, handling lost text, or deleting HTML tags. This process can be governed by manual commands and organization.
3.2.2. Punctuation Removal
Punctuation removal is the process of making the text more standard by removing punctuation marks, symbols, or other special characters that may affect data processing, such as (!”#$%&’*+,-./:;<=>?@[]^_`{ |}), etc. This process is completed by importing the “re” and “NLTK” libraries in Python as a deletion tool.
3.2.3. Word Tokenization
The module utilized “pythainlp.tokenize” from the PyThaiNLP library to divide the text into words (Chotisarn et al., 2022). It then used the package “word_tokenize” for word segmentation (PyThaiNLP, n.d. -a), resulting in sentences being segmented into words, as shown in Table 2.
Table 2
Word tokenization
| bachelor | degree | engineering | science | fields | experience |
| system | administrator | Unix | Sun | Solaris | operating |
| computer | Sybase | Oracle | database | networking | preferable |
| thesis | educate | relate | database | Administrator | manage |
| data | SQL | JAVA | experience | knowledge | framework |
| software | dynamics | implementation | good | english | skills |
| configuration | monitor | performance | Exceptional | frontend | support |
3.2.4. Stop Word Removal
The process of stop word removal involves eliminating frequently occurring words from documents or sentences that lack significance for analysis or knowledge extraction. To remove redundant words, we ran the “pythainlp.corpus” module in the “PyThaiNLP” library, followed by the “thai_stopwords” package (PyThaiNLP, n.d. -b) in Python, as illustrated in Table 3.
Table 3
Thai stop words
| têe | ที่ี | mâi′ | ไม่ | mee | มี | rěu | หรือ | lǽ′ | และ |
| jà′ | จะ | dhæ̀ | แต่ | dâi | ได้ | dee | ดี | bhai′ | ไป |
| sêung′ | ซึ่ง | an′ | อัน | doy | โดย | dûay | ด้วย | à′-yâng | อย่าง |
| gà′ | กะ | sǒong | สูง | bhen′ | เป็น | kêun′ | ขึ้น | nǽ′ | แนะ |
| gan | การ | kǎw | ขอ | nai′ | ใน | bon′ | บน | chên′ | เช่น |
| lǽo | แล้ว | ma | มา | à′-yâ | อย่า | nam′ | นำ | gwà | กว่า |
3.2.5. Feature Extraction (TF-IDF)
By configuring TF-IDF, feature extraction assigns features to words for analysis through machine learning processes. In this process, we ran the module “sklearn.feature_extraction.text” and the “TfidfVectorizer” and “CountVectorizer” package in the Python language (Chaudhary, 2020; Wendland et al., 2021) to find TF-IDF values, as shown in Table 4.
Table 4
Term frequency-inverse document frequency weighting word vectors
| Job position | Bachelor1 | Experience2 | Engineering3 | Database4 | Knowledge5 | ... | Word100 | Label |
|---|---|---|---|---|---|---|---|---|
| P1 | 0.2377 | 0.2168 | 0.3763 | 0.0000 | 0.2584 | … | 0.5549 | G2 |
| P2 | 0.0779 | 0.0711 | 0.0000 | 0.0000 | 0.3270 | … | 0.0000 | G1 |
| P3 | 0.3171 | 0.1446 | 0.0000 | 0.1735 | 0.4528 | … | 0.0000 | G3 |
| P4 | 0.2858 | 0.2607 | 0.4523 | 0.0000 | 0.1834 | … | 0.0000 | G3 |
| P5 | 0.0620 | 0.0566 | 0.0000 | 0.0000 | 0.2386 | … | 0.1448 | G4 |
| P6 | 0.0000 | 0.1232 | 0.0000 | 0.0000 | 0.4922 | … | 0.3070 | G5 |
| P7 | 0.0000 | 0.3117 | 0.0000 | 0.0000 | 0.0000 | … | 0.0000 | G4 |
| P8 | 0.1577 | 0.0719 | 0.2496 | 0.2639 | 0.1766 | … | 0.3586 | G1 |
| P9 | 0.1916 | 0.0874 | 0.0000 | 0.0000 | 0.3125 | … | 0.4356 | G5 |
| P10 | 0.1053 | 0.1928 | 0.2041 | 0.3123 | 0.0000 | … | 0.0000 | G5 |
| … | … | … | … | … | … | … | … | … |
| P24,494 | 0.1682 | 0.1534 | 0.2662 | 0.2814 | 0.2841 | … | 0.5549 | G1 |
Table 4 presents the TF-IDF weighting for words extracted from job position descriptions, showing their importance in different job postings. Each row represents a job position (P1 to P24,494), while each column represents a specific word feature (e.g., “bachelor,” “experience,” “engineering,” “database,” and “knowledge”), with corresponding TF-IDF scores indicating the significance of each term in the respective job posting. The final column, “label,” categorizes the job position into one of five groups (G1-G5).
From the Table 4, higher TF-IDF values suggest that a word is more relevant to a particular job description. For example, “engineering” has a high weight (0.4523) in P4, indicating its strong association with that job position. Similarly, “knowledge” has a high weight (0.4922) in P6, showing its importance for that specific job.
3.3. Data Analysis
To construct a predictive model, the researchers separated the data into two primary categories: trained data and test data. They defined k-fold cross-validation and divided the data into four groups: k=10, k=15, k=20, and k=25. They then imported the “sklearn.model_selection,” “KFold,” “cross_val_predict,” and “train_test_split” libraries in Python. After that, the researchers used Python to create a trained data set, as follows:
3.3.1. Logistic Regression Model
Create a logistic regression model, import the “sklearn.linear_model” library, and run the “LogisticRegression” package. Designed to find the sigmoid function for probability prediction, the logistic regression model typically is shaped like a curve on a graph with values ranging from 0 to 1. Based on the sigmoid equation, if the probability value is greater than or equal to 0.5, the model will assume the result to be 1, and if the value is less than 0.5, the model will assume the result to be 0 (Kanade, 2022).
where: f(x) is the output of the logistic function, x is the input to the function, e base of natural logarithms.
3.3.2. Decision Tree Model
Create a decision tree model, import the “sklearn.tree” library, and run the “DecisionTreeClassifier” package. By creating a hierarchical tree diagram with the root node as the top node and the starting point of the decision process, the decision tree model predicts successive outcomes (regression). The top node, known as the parent node, can split into two child nodes. The child node is the result of the parent node, while the leaf node represents the final decision. Every node must have a rule for decision-making, such as yes or no (Charbuty & Abdulazeez, 2021; Thanapatpisarn, 2022).
3.3.3. K-Nearest Neighbors (K-NN) Model
Construct a model with KNN to import the “sklearn.neighborslibrary” and run the “KNeighborsClassifier” package. The KNN model is a set of k-values to study the closest member data, such as k=5, which means only the first five data points that are close to the targeted point. Then, using the following equation, calculate the distance between the sample data of interest and other data using the Euclidean distance (Ninthanom, 2021).
where: DEuclidean(XiYi) is the Euclidean distance between the points Xi and Yi, Xi and Yi are the two points in n-dimensional space, Xi,k and Yi,k are the k-th coordinates of the points Xi and Yi, respectively, n is the number of dimensions.
3.3.4. Naïve Bayes Model
Construct a model with Naïve Bayes, import the “sklearn.naive_bayes” library, and run the “MultinomialNB” or “GaussianNB” package. The Naïve Bayes model is designed to investigate probability theory and statistics based on Bayes’ theorem to predict the label of new data (Ray, 2025). The probability value can be calculated based on the following equation:
where: P(A|B) is the conditional probability of event A occurring given that event B has occurred, P(B|A) is the conditional probability of event B occurring given that event A has occurred, P(A) is the marginal probability of event A occurring, P(B) is the marginal probability of event B occurring.
3.4. Model Evaluation
3.4.1. Performance Evaluation Metrics
The study used accuracy, precision, recall, and the F1-score (Kundur & Mallikarjuna, 2022) as key performance indicators to evaluate and rate the predictive efficiency of the model across various dimensions. These metrics provide a comprehensive understanding of the model’s capabilities in terms of correct predictions, handling imbalances in the dataset, and maintaining reliability in diverse scenarios. The following equations show how the efficiency was measured.
where: TP (true positives), the number of correctly predicted positive observations, TN (true negatives), the number of correctly predicted negative observations, FP (false positives), the number of incorrectly predicted positive observations, FN (false negatives), the number of incorrectly predicted negative observations.
3.4.2. External Validation
In addition to evaluating performance through metrics such as accuracy, precision, recall, and the F1-score, which constitute internal validation, this study also includes external validation (Manorom et al., 2024). Utilizing data not included in the model development process, the external validation process evaluates the accuracy of the model. Alternative datasets source this data, representing new information absent from the original dataset. The purpose is to examine whether the model performs effectively across diverse scenarios. In this step, we test the developed model using data from one website against data from other websites and industries. By doing so, this process mitigates the risk of overfitting. External validation guarantees the model’s generalizability and applicability to diverse contexts, without excessive customization to specific datasets.
3.5. Model Validation
To ensure the robustness and reliability of the predictive model, this study implements a structured validation process. Model validation is a crucial step in machine learning, distinguishing between development-phase validation and final model evaluation. The following validation techniques were applied:
3.5.1. K-Fold Cross-Validation
To assess model generalization and reduce variance, k-fold cross-validation was performed. The dataset was split into k subsets (k=10, 15, 20, and 25), where each fold was used as a test set while the remaining k-1 folds were used for training. The average performance across all folds provided a reliable estimate of the model’s predictive capability. This approach helps mitigate overfitting by ensuring the model is tested on multiple data partitions.
3.5.2. Hyperparameter Tuning
To optimize model performance, hyperparameter tuning was conducted using grid search and random search techniques. The “GridSearchCV” function from “scikit-learn” was employed to systematically evaluate different hyperparameter combinations, selecting the best-performing configuration based on accuracy, precision, recall, and F1-score. Randomized search was also used to explore a broader range of hyperparameter values efficiently.
3.5.3. Data Quality Verification
Before training, the dataset underwent integrity checks and preprocessing verification to ensure data consistency. This included:
-
Handling missing values by applying imputation techniques or removing incomplete entries.
-
Eliminating duplicate records to prevent data leakage.
-
Normalizing text data to standardize formats across job postings.
-
Ensuring label distribution balance to prevent model bias toward overrepresented classes.
By implementing these validation steps, this study ensures that the predictive model is well-optimized, generalizes effectively, and maintains methodological rigor in machine learning-based workforce prediction.
3.6. Data Application
This section outlines the process of utilizing the processed and analyzed data to derive actionable insights and implement practical solutions. We applied the results of the predictive models to two primary domains: educational curriculum development and digital industry workforce planning.
The educational implications of this study are particularly relevant to programs in information science and other digital-related disciplines. The predictive findings offer valuable insights for aligning academic curricula with emerging industry demands in data science, AI, digital marketing, user experience/user interface (UX/UI) design, and software development. These areas are increasingly critical to the growth and competitiveness of Thailand’s digital economy.
The findings from this study can be used by educational institutions to integrate the identified skills and competencies into their curricula, aligning academic programs with industry demands. This guarantees that graduates possess the essential skills to fulfill the workforce demands of the digital economy. The insights can inform the design of specialized courses and certifications to address emerging trends in digital services, such as data analysis, AI, and UX design.
The digital industry can apply the data to support strategic workforce planning. Organizations can leverage the predictions the predictions to identify future skill gaps, enabling them to implement targeted training programs and talent acquisition strategies. The findings also can also facilitate industry-wide initiatives to prepare for the increasing demand for digital service professionals by fostering collaborations between private sector organizations and educational institutions.
The application of data derived from this study bridges the gap between academia and industry, contributing to a more skilled and adaptable workforce and supporting sustainable growth in Thailand’s digital economy.
This study is structured as a case study on workforce prediction in Thailand’s digital industry, utilizing job posting data from 2023 to 2024. To ensure clarity in scope, the dataset limitations and case boundaries are explicitly stated in the methodology section. Additionally, the industry analysis has been incorporated into the methodology to provide contextual background, while the conclusion focuses on model performance, implementation constraints, and future research directions for broader workforce applications.
4. STUDY RESULTS
In this section, we present the findings from our study, detailing the development and evaluation of models using various techniques. We rigorously tested and analyzed each model’s performance to determine its effectiveness.
4.1. Study Results with Model Development
This section presents the outcomes of the model development process using four different techniques. We partitioned the data using k-fold cross-validation to ensure robust model testing and evaluation. Specifically, the dataset was split into 80% for training and 20% for testing, with a random state of 5 to ensure reproducibility. We calculated key performance metrics such as accuracy, precision, recall, and F1-score to evaluate each model’s effectiveness. Table 5 summarizes the detailed results.
Table 5
Predictive model performance evaluation results
| k-fold | Algorithm | Accuracy | Precision | Recall | F1-score |
|---|---|---|---|---|---|
| 10-fold | Logistic regression | 0.624 | 0.715 | 0.504 | 0.507 |
| Decision tree | 0.707 | 0.668 | 0.665 | 0.666 | |
| K-nearest neighbor | 0.790 | 0.787 | 0.727 | 0.747 | |
| Naïve Bayes | 0.545 | 0.555 | 0.489 | 0.474 | |
| 15-fold | Logistic regression | 0.625 | 0.513 | 0.507 | 0.508 |
| Decision tree | 0.707 | 0.663 | 0.662 | 0.663 | |
| K-nearest neighbor | 0.791 | 0.789 | 0.729 | 0.749 | |
| Naïve Bayes | 0.545 | 0.553 | 0.489 | 0.474 | |
| 20-fold | Logistic regression | 0.628 | 0.677 | 0.509 | 0.512 |
| Decision tree | 0.712 | 0.672 | 0.670 | 0.671 | |
| K-nearest neighbor | 0.792 | 0.790 | 0.729 | 0.749 | |
| Naïve Bayes | 0.546 | 0.554 | 0.489 | 0.474 | |
| 25-fold | Logistic regression | 0.628 | 0.715 | 0.510 | 0.511 |
| Decision tree | 0.714 | 0.676 | 0.671 | 0.673 | |
| K-nearest neighbor | 0.792 | 0.793 | 0.731 | 0.751 | |
| Naïve Bayes | 0.545 | 0.553 | 0.489 | 0.474 |
The results demonstrate that the KNN model, with k set to 5, outperforms other predictive models, achieving the highest k-fold number of 25. The model demonstrates an accuracy value of 0.792, a precision value of 0.793, a recall value of 0.731, and an F1-value score of 0.751.
From Table 5, it is evident that KNN consistently achieves the highest performance across all k-fold values, with notable improvements in accuracy, precision, recall, and F1-score as k increases. The decision tree model performs well, ranking second in most cases, but falls short compared to KNN. Logistic regression exhibits moderate performance but struggles with recall, indicating weaker capability in identifying all relevant instances. Naïve Bayes consistently underperforms across all metrics, showing particularly low recall and F1-score, suggesting limited predictive reliability. These results confirm that KNN is the most effective model for workforce prediction in this study.
4.2. Results of Prediction
When four predictive models were applied to predict future workforce requirements in the digital industry, three of the models consistently indicated that the digital service sector would demand the highest number of jobs. This outcome is illustrated in Figs. 2Fig. 3Fig. 4-5, which demonstrate that the digital service industry is expected to experience the greatest increase in job demand across the models.
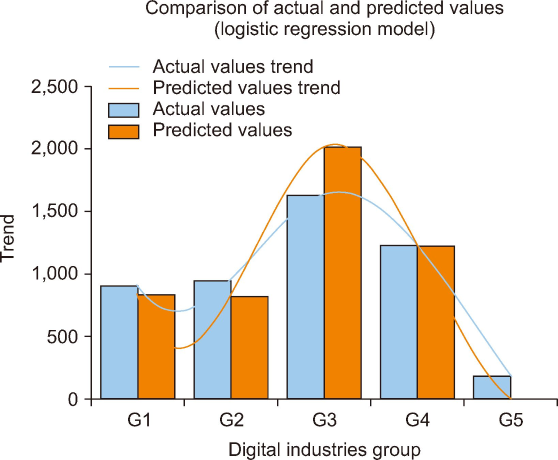

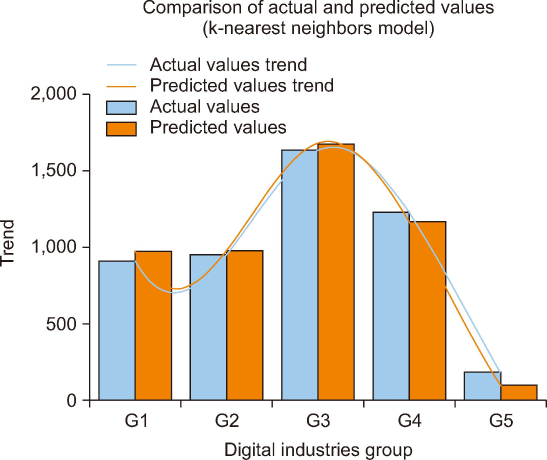
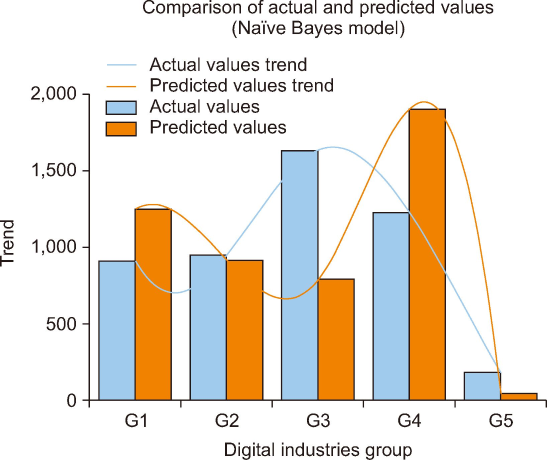
Fig. 2 illustrates a comparison between actual and predicted job demand values using the logistic regression model across five digital industry groups (G1-G5). The actual values (blue bars) and predicted values (red bars) generally follow a similar trend, with the model effectively capturing the increasing demand in G3, which shows the highest job demand. The trend lines indicate that the model aligns well with actual trends in G1 to G3, while slight underestimations occur in G4 and G5. Overall, the model successfully predicts workforce demand patterns in the digital industry, with minor deviations suggesting potential improvements through further optimization or additional data sources.
Fig. 3 illustrates a comparison between actual and predicted job demand values using the decision tree model across five digital industry groups (G1-G5). The actual values (blue bars) and predicted values (red bars) generally follow a similar pattern, with the model effectively capturing the peak demand in G3. The trend lines indicate that the model aligns well with actual trends, especially in G1 to G4, but shows a slight overestimation in G3 and G4, while G5 exhibits minor underestimation. Overall, the decision tree model demonstrates strong predictive capability in workforce demand estimation, with some discrepancies suggesting possible refinements in feature selection and model tuning for improved accuracy.
Fig. 4 presents a comparison of actual and predicted job demand values using the KNN model across five digital industry groups (G1-G5). The actual values (blue bars) and predicted values (red bars) show a similar distribution, with the model accurately capturing job demand trends in G1 to G3. However, minor discrepancies appear in G4 and G5, where the model slightly underestimates demand. The trend lines indicate that the KNN model follows the general shape of actual demand but tends to smooth out variations, leading to slight overestimations in some groups. Overall, the KNN model performs well in workforce prediction but could benefit from further tuning to refine accuracy in lower-demand categories.
Fig. 5 presents a comparison of actual and predicted job demand values using the Naïve Bayes model across five digital industry groups (G1-G5). While the model captures some trends, notable discrepancies exist, particularly in G3 and G4, where the predicted values (red bars) significantly deviate from actual values (blue bars). The trend lines show that the model struggles to align with actual job demand patterns, especially overestimating demand in G4 and underestimating in G3 and G5. This suggests that the Naïve Bayes model may not be as effective in workforce prediction due to its assumption of feature independence, which may not fully capture complex job market patterns. Further refinements, such as feature engineering or hybrid modeling approaches, could improve its predictive performance.
4.3. ROC Curve and AUC Analysis of Predictive Models
The ROC curve and the AUC for each model, as presented in Figs. 6Fig. 7Fig. 8-9, provide a comprehensive evaluation of their performance. The ROC curve visually represents the trade-off between the TP rate (sensitivity) and the FP rate (1-specificity) at various threshold settings. The AUC quantifies the overall ability of the model to discriminate between the positive and negative classes, with a value of 1 indicating perfect classification and a value of 0.5 representing random guessing. Together, these metrics offer a clearer and more complete understanding of how effectively each model distinguishes between the five classes.
Fig. 6
Receiver operating characteristic (ROC) curve values are displayed using a logistic regression model. AUC, area under the curve.
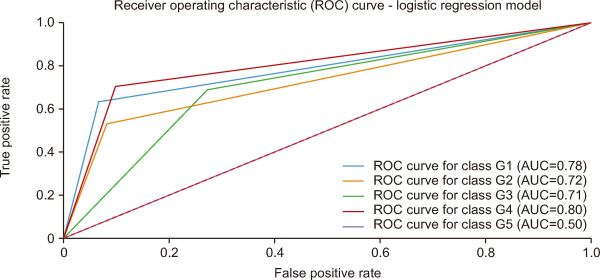
Fig. 7
Receiver operating characteristic (ROC) curve values are displayed using a decision tree model. AUC, area under the curve.

Fig. 8
Receiver operating characteristic (ROC) curve values are displayed using a k-nearest neighbor model. AUC, area under the curve.
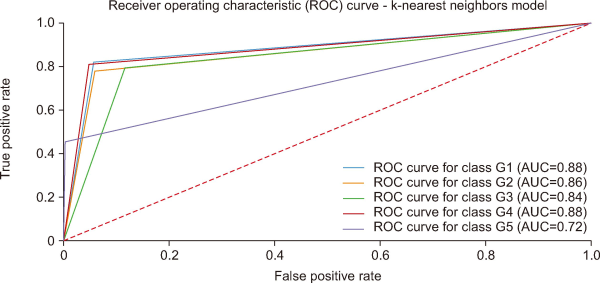
Fig. 9
Receiver operating characteristic (ROC) curve values are displayed using a Naïve Bayes model. AUC, area under the curve.
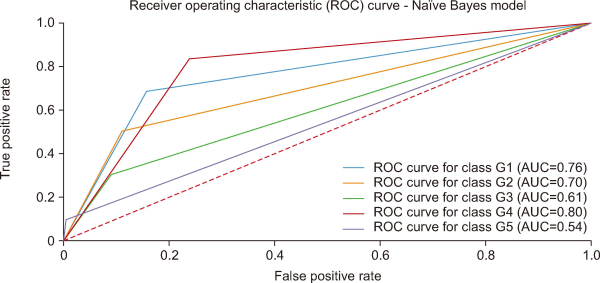
Fig. 6 presents the ROC curve for the logistic regression model, illustrating its classification performance across five digital industry groups (G1-G5). The AUC values indicate the model’s ability to distinguish between classes, with G4 achieving the highest AUC (0.80), followed by G1 (0.78), suggesting strong predictive performance in these categories. G2 (0.72) and G3 (0.71) show moderate classification capability, while G5 (0.50) indicates poor distinction, performing at a random classification level. Overall, the model performs well for certain groups but may require further optimization, particularly for improving classification in G5.
Fig. 7 shows the ROC curve for the decision tree model, illustrating its classification performance across five digital industry groups (G1-G5). The AUC values indicate that G1 (0.84) and G4 (0.83) exhibit relatively strong predictive capability, while G2 (0.83) and G3 (0.78) show moderate performance. G5 (0.70) demonstrates the lowest distinction, suggesting that further model refinement may be necessary to enhance its classification accuracy in this group.
Fig. 8 presents the ROC curve for the KNN model, illustrating its classification performance across five digital industry groups (G1-G5). The AUC values indicate that G1 and G4 achieve the highest classification performance with an AUC of 0.88, followed by G2 (0.86) and G3 (0.84), showing strong but slightly lower predictive capability. G5 has the lowest AUC (0.72), suggesting weaker model performance in distinguishing this category. Overall, the KNN model demonstrates robust classification accuracy for most groups, with some limitations in predicting G5, which may require further optimization or feature engineering.
Fig. 9 presents the ROC curve for the Naïve Bayes model, illustrating its classification performance across five digital industry groups (G1-G5). The AUC values indicate that G4 achieves the highest predictive capability (AUC=0.80), followed by G1 (0.76) and G2 (0.70), showing moderate performance. However, G3 (0.61) and G5 (0.54) exhibit lower AUC scores, suggesting weaker classification accuracy, particularly for G5, which is close to random prediction. Overall, while the Naïve Bayes model performs reasonably well for certain groups, its assumptions of feature independence may limit its effectiveness in capturing complex patterns, necessitating further optimization or alternative modeling approaches.
Table 6 presents the AUC values for each predictive model across five different groups (G1-G5). These values indicate each model’s performance in terms of distinguishing between classes, with higher values suggesting better model accuracy in predicting workforce requirements. The comparison between models, including logistic regression, decision tree, KNN, and Naïve Bayes, reveals significant variations in performance across different groups.
Table 6
Area under the curve values in each predictive model
| Model | Area under the curve | ||||
|---|---|---|---|---|---|
| G1 | G2 | G3 | G4 | G5 | |
| Logistic regression | 0.78 | 0.72 | 0.71 | 0.80 | 0.50 |
| Decision tree | 0.84 | 0.83 | 0.78 | 0.84 | 0.70 |
| K-nearest neighbor | 0.88 | 0.86 | 0.84 | 0.88 | 0.72 |
| Naïve Bayes | 0.76 | 0.70 | 0.61 | 0.80 | 0.54 |
From the Table 6, the KNN model demonstrates the highest overall performance, achieving the highest AUC values across most groups, particularly in G1 (0.88) and G4 (0.88). The decision tree model also performs well, with AUC values exceeding 0.80 in all groups except G3 and G5. logistic regression shows moderate performance, particularly struggling in G5 (0.50), indicating poor classification ability for this group. The Naïve Bayes model exhibits the weakest performance, with an AUC as low as 0.54 for G5 and 0.61 for G3, suggesting difficulty in distinguishing these categories effectively. Overall, the KNN and decision tree models outperform the others, making them more reliable for workforce prediction tasks.
5. DISCUSSION
Using four machine-learning techniques, this study developed a predictive framework to forecast future workforce requirements in Thailand’s digital industry. Notably, the KNN model outperformed logistic regression, decision tree, and Naïve Bayes models, achieving an accuracy of 0.792, precision of 0.793, recall of 0.731, and an F1-score of 0.751 under a 25-fold cross-validation setup. While the KNN model demonstrated marked improvements in accuracy, precision, and F1-score compared to previous studies (Okoye et al., 2024), the recall metric remained consistent, suggesting that specific data characteristics may influence model sensitivity.
Our findings reinforce the growing body of research that highlights the efficacy of machine learning in workforce prediction. Similar to the work of Okoye et al. (2024), the superior performance of the KNN model underlines its potential for accurately forecasting labor market trends based on job posting data. Additionally, the observed upward trend in digital service job demand is consistent with industry reports (6Wresearch, 2025; TheReporterAsia, 2024) and is likely driven by rapid digital transformation, government initiatives, and evolving consumer behavior (Dharmaraj, 2024).
Despite these promising results, several limitations should be noted. First, the dataset is restricted to job postings from 2023 to 2024 within Thailand’s digital industry, potentially limiting the model’s generalizability to broader or multi-regional contexts. Second, the reliance on text-based job advertisement data may introduce biases due to variability in job description formats and potential underrepresentation of specific roles. Future research should consider integrating cross-industry, longitudinal, and multi-regional data to enhance the robustness and applicability of the predictive model.
The insights derived from this study have significant practical implications. For industry stakeholders, the ability to predict workforce requirements can inform strategic human resource planning, targeted training initiatives, and proactive talent acquisition strategies. For educational institutions, these findings provide a data-driven basis for curriculum design—ensuring academic programs align with emerging digital competencies and market demands. The study supports a more responsive and future-ready workforce by bridging the gap between labor market intelligence and educational outcomes.
The introduction outlined the rapid evolution of Thailand’s digital industry and the need for agile workforce planning to address emerging skill gaps. The results presented here confirm these trends and offer a quantitative validation of the potential for machine learning to enhance predictive accuracy in workforce planning. The strong performance of the KNN model, in particular, validates the initial hypothesis that advanced data analytics can provide actionable insights into the future needs of the digital service sector.
It is important to recognize that the predictive results primarily reflect workforce demand for early-career professionals. This limitation arises from the dataset, which was derived mainly from job postings targeting recent graduates and individuals with a few years of professional experience. Future research should incorporate data sources that capture senior-level and executive positions to obtain a more comprehensive view of labor market trends.
In summary, this research demonstrates that machine learning, particularly the KNN model, can be a powerful tool in forecasting workforce requirements within the digital industry. The integration of robust validation techniques—such as k-fold cross-validation, hyperparameter tuning, and comprehensive data quality checks—ensures the model is reliable and adaptable. These findings advance the theoretical framework of labor market intelligence and provide a practical foundation for strategic workforce planning and curriculum development. Ultimately, the study highlights the critical role of data-driven decision-making in preparing for the evolving challenges of the digital economy.
6. CONCLUSION
This study developed a comprehensive predictive model to forecast the future workforce requirements of Thailand’s rapidly evolving digital industry. The data collection process involved gathering information from multiple sources, including job advertisements, recruitment websites, and relevant web pages, ensuring a diverse and extensive dataset for analysis. After data collection, we utilized NLP techniques to clean, tokenize, and extract meaningful features from the text, transforming it into a suitable format for predictive modeling.
Four machine learning algorithms were employed to construct the predictive models: logistic regression, decision tree, KNN, and Naïve Bayes. Each model was evaluated using several performance metrics, including accuracy, precision, recall, F1-score, and AUC, to gauge its capacity to forecast workforce trends in the digital industry. After constructing the models, a thorough evaluation was conducted to re-examine their prediction performance.
The results of the predictive models indicate a continuous increase in workforce requirements within the digital industry, which is growing at a faster pace compared to other sectors. Specifically, the KNN model demonstrated superior prediction accuracy, particularly in the digital services sector. These findings provide valuable insights into the future skill requirements and workforce trends, which can be highly beneficial for the development of educational curricula. Additionally, the insights from these predictions can serve as a strategic tool for digital industry organizations to better plan for the workforce they will need in the future.
Educational institutions can align their programs with industry needs and equip graduates with the necessary skills for the future workforce by analyzing the forecasted trends in job demand and required skill sets. The following can be guided by the study’s findings:
-
Curriculum design: By incorporating the identified key skills and competencies into their courses, educational institutions can equip students for high-demand roles in the digital industry, especially in digital service roles as predicted by the predictive model. For instance, academic programs can emphasize areas such as UX/UI design, e-commerce specialists, data analysts, social media managers, or digital marketing managers if the prediction indicates a growing need for expertise in these areas.
-
Course offerings: Based on the study’s predictions, universities and vocational training centers can introduce specialized courses or certifications focused on emerging technologies, ensuring that the workforce is ready for upcoming digital trends. This would enable organizations in the digital sector to hire graduates who possess the specific skills required to adapt to industry shifts.
-
Skills gap analysis: By comparing the study’s workforce predictions with the current curriculum, institutions can identify gaps in their existing offerings. This analysis helps institutions make informed decisions about adapting or expanding their programs to better meet industry requirements. For digital organizations, this alignment ensures a smoother transition from education to employment, as graduates will be more immediately employable in the rapidly evolving job market.
-
Long-term planning: Educational institutions can use the study’s results to inform long-term curriculum planning, ensuring that academic programs remain relevant and responsive to the evolving digital job market. For the digital industry, this allows for a more predictable pipeline of skilled talent, helping organizations plan for future recruitment needs with greater accuracy.
-
Making strategic decisions: Predictive data aids educational institutions and organizations in making informed strategic decisions about curriculum development and workforce training, ensuring that the right skills are being developed to meet future requirements.
This study presents a case study on workforce prediction in Thailand’s digital industry using job posting data from 2023 to 2024. The findings demonstrate the effectiveness of machine learning models in predicting workforce requirements; however, the study’s scope is limited by geographic, temporal, and industry constraints. To enhance generalizability, future research should incorporate multi-regional and cross-industry datasets, extend the study period, and explore additional data sources beyond job postings. These steps would help broaden the applicability of the proposed framework for workforce planning on a larger scale.
In conclusion, the predictive models collectively indicate a continuous increase in workforce requirements within Thailand’s rapidly growing digital industry, particularly in digital services. Expected to outpace other sectors, this surge underscores the importance of preparing for the rising need for skilled professionals in the digital economy. The study’s findings offer significant insights for modifying educational programs and curricula to better meet future workforce requirements, equipping students with the necessary skills for digital service roles in the digital industry. Additionally, these insights are crucial for digital industry organizations in strategically planning their workforce needs and ensuring that their teams are well-prepared to meet the challenges of an ever-evolving market. Strategic workforce planning and curriculum development are critical to addressing this growing demand and meeting the evolving needs of both the education sector and the industry, ultimately contributing to a more skilled and industry-ready workforce.
Accordingly, the educational reforms proposed in this study are specifically tailored to the context of information science and digital technology programs rather than being broadly generalized. These reforms are designed to address the disconnect between academic training and industry requirements, by ensuring that graduates are equipped with the relevant competencies demanded in key areas such as digital services, marketing technology, and intelligent systems.
REFERENCES
6Wresearch (2025) Thailand digital market (2025-2031) outlook | Trends, value, revenue, growth, analysis, share, forecast, companies, size & industry https://www.6wresearch.com/industry-report/thailand-digital-market Article Id (other)
, , , , , , , , (2023, March 14-15) 2023 Sixth International Conference of Women in Data Science at Prince Sultan University (WiDS PSU) IEEE Web scraping for data analytics: A BeautifulSoup implementation, 65-69, https://doi.org/10.1109/WiDS-PSU57071.2023.00025
, (2023, December 10-11) 2023 IEEE Global Conference on Artificial Intelligence and Internet of Things (GCAIoT) IEEE Predicting the sustainable career paths of working women in the UAE Private sector using machine learning, 174-178, https://doi.org/10.1109/GCAIoT61060.2023.10385133
, , , (2023, August 25-27) 2023 IEEE 8th International Conference on Software Engineering and Computer Systems (ICSECS) IEEE A supervised machine learning method for predicting the employees turnover decisions, 122-127, https://doi.org/10.1109/ICSECS58457.2023.10256357
BDE Digital Competence TestDigital competency framework for Thai citizens https://www.ondedigitalct.online/competenceframe Article Id (other)
, , , (2021, September 24-26) 2021 IEEE 4th International Conference on Computing, Power and Communication Technologies (GUCON) IEEE Study and prediction analysis of the employee turnover using machine learning approaches, 65-69, https://doi.org/10.1109/GUCON50781.2021.9573759
, (2020) International Journal of Innovation, Creativity and Change (Vol. 11) Thai Twitter sentiment analysis: Performance monitoring of politics in Thailand using text mining techniques, 12, pp. 436-452, https://www.ijicc.net/images/vol11iss12/111227_Chansanam_2020_E_R.pdf Article Id (other)
, (2021) Classification based on decision tree algorithm for machine learning Journal of Applied Science and Technology Trends, 2, 20-28 https://doi.org/10.38094/jastt20165.
(2020) TF-IDF Vectorizer scikit-learn https://medium.com/@cmukesh8688/tf-idf-vectorizer-scikit-learn-dbc0244a911a Article Id (other)
, , , , (2022) Paper presented at The International Conference on Electronic Business Bangkok, Thailand Finding customer behavior insights for content creation in material and product sourcing using specialized topic analysis, https://aisel.aisnet.org/iceb2022/17, Article Id (other)
depa (n.d.) Thailand digital economy glance https://www.depa.or.th/th/article-view/thailand-digital-economy-glance Article Id (other)
(2024) Thailand's digital boom: Economy, cybersecurity, and AI on the rise https://archive.opengovasia.com/2024/10/15/thailands-digital-boom-economy-cybersecurity-and-ai-on-the-rise/?c=kr
, , , , , , (2023, December 15-16) Transfer, Diffusion and Adoption of Next-Generation Digital Technologies. TDIT 2023. IFIP Advances in Information and Communication Technology Springer, Cham Human resource analytics: Leveraging machine learning for employee attrition prediction, 137-158, https://doi.org/10.1007/978-3-031-50188-3_13
(2022) What is logistic regression? Equation, assumptions, types, and best practices https://www.spiceworks.com/tech/artificial-intelligence/articles/what-is-logistic-regression/ Article Id (other)
, , (2023) Predicting declining and growing occupations using supervised machine learning Journal of Computational Social Science, 6, 757-780 https://doi.org/10.1007/s42001-023-00211-0.
, (2022) Deep convolutional neural network architecture for plant seedling classification Engineering, Technology & Applied Science Research, 12(6), 9464-9470 https://doi.org/10.48084/etasr.5282.
, , , , (2023) Optimising vitrectomy operation note coding with machine learning Clinical & Experimental Ophthalmology, 51, 577-584 https://doi.org/10.1111/ceo.14257.
, , (2024) Comparative assessment of fraudulent financial transactions using the machine learning algorithms decision tree, logistic regression, Naïve Bayes, k-nearest neighbor, and random forest Engineering, Technology & Applied Science Research, 14(4), 15676-15680 https://doi.org/10.48084/etasr.7774.
, , , , , , , (2024) Proceedings of Fifth International Conference on Computer and Communication Technologies Singapore: Springer Uncovering insights in agroforestry: A text mining analysis using web scraping and topic modeling, pp. 95-104, https://doi.org/10.1007/978-981-99-9704-6_8
(2021) Performance comparison of transformation methods in data mining classification technique Thai Journal of Science and Technology, 10, 14-25 https://doi.org/10.14456/tjst.2021.2.
, , , (2024) Machine learning model (RG-DMML) and ensemble algorithm for prediction of students' retention and graduation in education Computers and Education: Artificial Intelligence, 6, 100205 https://doi.org/10.1016/j.caeai.2024.100205.
, , (2020) The architecture of intelligent career prediction system based on the cognitive technology for producing graduates to the digital manpower International Journal of Advanced Computer Science and Applications, 11, 115-121 https://dx.doi.org/10.14569/IJACSA.2020.0111214.
, , , , (2023) Forecasting labor needs for digitalization: A bi-partite graph machine learning approach World Patent Information, 73, 102193 https://doi.org/10.1016/j.wpi.2023.102193.
(2014) A model for forecasting the appropriate manpower for the workload: A case study of the branches of CP All Public Company Limited Panyapiwat Journal, 5, 103-119 https://so05.tci-thaijo.org/index.php/pimjournal/article/view/20129. Article Id (other)
PyThaiNLP (n.d. -a) pythainlp.tokenize https://pythainlp.org/dev-docs/api/tokenize.html Article Id (other)
PyThaiNLP (n.d. -b) pythainlp.corpus https://pythainlp.org/dev-docs/api/corpus.html Article Id (other)
, (2022, October 25-26) 2022 International Conference on Data Analytics for Business and Industry (ICDABI) IEEE Machine learning as a data science tool to predict absenteeism for factory workers, 261-265, https://doi.org/10.1109/ICDABI56818.2022.10041623
(2025) Naive Bayes classifier explained: Applications and practice problems of Naive Bayes classifier https://www.analyticsvidhya.com/blog/2017/09/naive-bayes-explained Article Id (other)
, , , , (2024) Enhancing ASD detection accuracy: A combined approach of machine learning and deep learning models with natural language processing Health Information Science and Systems, 12, 20 https://doi.org/10.1007/s13755-024-00281-y. Article Id (pmcid)
SCB 10X (2023) Find out more about natural language processing (NLP), a tool that enables computers to comprehend language https://www.scb10x.com/en/blog/natural-language-processing Article Id (other)
, , , , 2023 6th International Conference on Advances in Science and Technology (ICAST) IEEE Campus placement using machine learning: An extensive review and comparative study of machine learning methods, pp. 427-430, https://doi.org/10.1109/ICAST59062.2023.10455050
(2022) Decision tree: A tree model with the complexity of decision making!!! Part 1 https://datascihaeng.medium.com/decision-tree-part01-47ef24539fba Article Id (other)
TheReporterAsia (2024) depa - IMC reveals Thai digital industry growth of 3.88% in 2023 https://thereporter.asia/eng/2024/09/depa-imc-thai-digital-industry/ Article Id (other)
, , , , , , (2021) Systems, Software and Services Process Improvement Cham: Springer Introduction to text classification: Impact of stemming and comparing TF-IDF and count vectorization as feature extraction technique, pp. 289-300, https://doi.org/10.1007/978-3-030-85521-5_19