1. INTRODUCTION
Since the introduction of OpenAI’s ChatGPT service, open government data (OGD) has increasingly been recognized as a critical resource driving digital transformation, particularly as this transformation accelerates across various sectors of society (Mhlanga, 2023). Within this context, OGD is frequently highlighted as a sustainable resource for value creation, with the potential to significantly contribute to both social and economic advancement (Hamari et al., 2016). Moreover, in the realm of corporate sustainability and environment, social, governance (ESG) management, Helbig (2021) posits that leveraging OGD offers substantial strategic value, enhancing operational efficiency and fostering innovation (Helbig et al., 2021). Governments have actively promoted open government policies to enhance the accessibility and utilization of OGD as a substantial source of information. Since the launch of open government initiatives in the United Kingdom and the United States in 2009, numerous countries, including South Korea, have pursued efforts to drive innovation and increase transparency through the use of OGD (O’Hara, 2012; Peled, 2011). In short, developed countries have been quantitatively expanding open data since the beginning of their policies, and this has created considerable added value based on OGD.
However, the translation of quantitative outputs of OGD into qualitative outcomes remains limited (Hong, 2014). The fundamental value of OGD lies not merely in its availability but in its applicability to real-world business and societal contexts. In other words, the true potential of OGD is realized when end users can effectively leverage it (Janssen et al., 2012). Given that the utility derived from OGD represents the core of its value (Weerakkody et al., 2017), proactive measures should be taken to evaluate and enhance data usability from the perspective of the end user. Research on the utilization of OGD has explored various aspects but has often taken a reactive approach, focusing on indirect factors rather than the primary purpose of OGD utilization. For instance, studies on OGD legislation and governance have highlighted the importance of clarifying the interplay between related laws and regulations, cautioning against the indiscriminate enactment and amendment of OGD-related legislation in an era of rapid societal change (Kim, 2023; Kim & Lee, 2020). These studies emphasize the need for a robust and coherent legal framework (Devins et al., 2017). Regarding OGD utilization policies, some research has compared the OGD policies of different Korean administrations, initially emphasizing the principle of openness (Kim et al., 2023). Other studies, based on analyses of OGD policies, have recommended identifying data closely tied to everyday life to enhance utilization and designing policies from a user-centric perspective (Yun & Hyun, 2019). Additionally, research on OGD technology has provided technical recommendations for improving the infrastructure of platforms that host OGD. These studies have also offered insights into tools and technical standards for data analysis (Jetzek et al., 2013; Lee, 2020; Máchová et al., 2018; Osagie et al., 2017).
The field of automated machine learning (AutoML) has witnessed remarkable progress over the past decade, achieving significant breakthroughs across multiple core domains, including model selection (Feurer et al., 2015; Thornton et al., 2013), hyperparameter optimization (Bergstra & Bengio, 2012; Snoek et al., 2012), and neural architecture search (Real et al., 2019; Zoph & Le, 2017). These foundational advances have established AutoML as a transformative paradigm that efficienates machine learning by automating traditionally labor-intensive optimization processes. Contemporary AutoML research has predominantly concentrated on conventional machine learning tasks, with substantial emphasis on image classification (Elsken et al., 2019), natural language processing (So et al., 2019), and time series forecasting (Kang et al., 2017). This body of work has primarily pursued performance optimization objectives using curated benchmark datasets, reflecting the field’s emphasis on algorithmic sophistication and computational efficiency.
However, existing AutoML research exhibits several critical limitations that constrain its practical applicability. First, the predominant focus on algorithmic performance optimization has overshadowed considerations of data quality and structural characteristics, thereby limiting the predictive utility of these systems when deployed on heterogeneous and incomplete datasets typical of public sector environments (Zöller & Huber, 2021). This algorithmic myopia represents a fundamental misalignment between research priorities and real-world data complexity. Second, current evaluation frameworks rely heavily on static performance metrics such as accuracy and F1-score, failing to capture the dynamic and contextual factors that characterize actual OGD data utilization patterns and user requirements (Hutter et al., 2019). This narrow evaluation paradigm inadequately reflects the multifaceted nature of public sector AI deployment scenarios, where performance must be assessed within broader operational and stakeholder contexts. Third, the application domain of AutoML research has been disproportionately concentrated on commercial and academic benchmarking tasks, consequently neglecting the unique challenges and opportunities presented by public sector data governance and policy-oriented applications. This bias has resulted in a systematic underexploration of AutoML’s potential for generating social value and supporting evidence-based policymaking processes.
The AutoML approach employed in this study presents a novel methodological framework for systematically analyzing the complex stakeholder networks and innovative civic engagement processes that have long captivated information science researchers within OGD ecosystems. The contemporary emphasis on dynamic development approaches for OGD platform ecosystem construction, which prioritizes early-stage user engagement, finds strong methodological support in the AutoML framework. By leveraging metadata accumulated through user participation, this approach provides empirical foundations for continuous system improvement processes. The integration of user-generated metadata with automated learning algorithms creates feedback loops that can inform adaptive platform design and enhance stakeholder engagement strategies over time.
The core methodological approach of this research is grounded in Information Triangulation Theory, a well-established principle in the social sciences. Triangulation refers to the deliberate use of multiple data sources, methods, or theoretical perspectives to overcome the inherent biases and limitations of a single-method or single-observer study (Denzin, 2009). The central premise of this theory is that by cross-validating a phenomenon from diverse standpoints, a study can achieve a higher degree of credibility and validity in its findings (Patton, 2014). When information from multiple, distinct sources converges on a consistent conclusion, that conclusion is considered more robust and trustworthy than one derived from any single source alone.
This principle provides a compelling theoretical rationale for the central comparison in this study: integrated versus domain-specific training. The use of an integrated data training strategy can be conceptualized as a computational analogue to data triangulation. By combining heterogeneous metadata from disparate government domains into a single dataset, the predictive models are exposed to a more holistic view of the information ecosystem, allowing them to learn beyond the limited perspective and potential biases of any one domain. This research, therefore, hypothesizes that the triangulation of information afforded by multi-domain data will enable the construction of more generalizable and accurate predictive models than those trained on siloed, domain-specific data. This study empirically tests whether this data integration strategy, grounded in triangulation theory, can provide a more reliable understanding of the complex phenomenon of OGD utilization.
While prior studies have largely proposed reactive and prescriptive measures for OGD utilization, they have been limited in proactively addressing utilization challenges. Few studies have offered forward-looking solutions in this regard. Against this backdrop, the present study seeks to address the following research questions: (1) Is AutoML an appropriate tool for measuring and evaluating the utilization of OGD? (2) How does the composition of the training data affect the performance of models designed to predict OGD utilization? These questions serve as the foundation for the analysis presented in this study. In other words, these research questions were formulated by identifying research gaps through a review of the literature. The results of the research questions explored in this study can contribute to the advancement of the data business and enhance the products and services associated with it.
2. RELATED RESEARCH
2.1. Research on Open Government Data
OGD has increasingly been recognized as a resource for innovation, capable of generating added value through its inherent characteristics (Blakemore & Craglia, 2006; Charalabidis et al., 2018). The benefits of actively leveraging OGD have been identified across diverse stakeholders—such as researchers, businesses, and policymakers—who use it to develop new business opportunities or enhance decision-making processes (Zhang et al., 2005). Notably, several studies have demonstrated that utilizing OGD fosters innovation in the products and services of private companies across various sectors (Kitsios et al., 2017). The use of OGD is further emphasized as a means to facilitate data-driven business integration, enhance decision support, and improve overall business quality (Janssen & Zuiderwijk, 2014). Legal and governance research on OGD utilization highlights its contributions to achieving diverse social and political objectives, such as increasing transparency, fostering public participation, enhancing democratic accountability, promoting economic growth and innovation, and improving public sector efficiency while reducing costs. However, these studies also underscore the potential risks, such as threats to privacy and related rights due to the disclosure of government data containing personal information (Borgesius et al., 2015).
In terms of policy research, Janssen and Zuiderwijk (2014) noted that governments seek to encourage the disclosure and use of OGD to derive significant benefits. Drawing on an analysis of Dutch government agency policies, the study proposes a framework for evaluating OGD policies. This framework identifies four critical elements for policy assessment: the policy environment and context, the content of the policy, performance indicators, and the public value created through data utilization. Through these prior studies, it is evident that research from diverse perspectives has been actively conducted to enhance the utilization of OGD. However, much of the existing research has taken an indirect and reactive approach to assessing the value of OGD utilization. In response, this study seeks to propose a differentiated framework to proactively measure and evaluate the intangible value of OGD utilization. Specifically, the study focuses on data provided by the Korean government, aiming to develop a more direct and forward-looking approach to assess its potential value.
2.2. Research on Information Triangulation Theory and Prediction Models
The superior performance of models trained on integrated datasets can be theoretically grounded in the principles of Information Triangulation. Originating as a methodological concept in the social sciences, triangulation refers to the practice of using multiple data sources, methods, or theories to obtain a more robust and validated understanding of a phenomenon (Denzin, 2009). The core tenet is that synthesizing information from diverse perspectives can mitigate the biases inherent in any single source, thereby leading to a more comprehensive and credible conclusion (Patton, 2014). In the context of this study, the integrated training approach serves as a computational analogue to data triangulation. By combining metadata from disparate government domains, the model gains a more holistic view of the data ecosystem, enabling it to learn more generalizable patterns than would be possible from a single, siloed domain.
This study employs machine learning as a tool for the quantitative evaluation of OGD utilization. Machine learning has already been widely applied across various domains closely tied to daily life, including transportation (Bak & Kim, 2023), healthcare (Kruppa et al., 2012), information and communication (Lee et al., 2021), and environmental studies (Ahmed et al., 2019). Its introduction has significantly expanded the scope of insights and knowledge that can be applied within these fields.
Numerous studies have leveraged machine learning to predict patent counts, which serve as indicators of utilization in the patent domain. For instance, classification algorithms such as Self-Organizing Maps (SOM), Kernel Principal Component Analysis (KPCA), and support vector machines (SVM) have been applied to classify patent utilization (Wu et al., 2016). Similarly, XGBoost, a boosting-based classification algorithm, has been employed to predict patent counts (Cho & Lee, 2018). Moreover, Erdogan et al. (2024) explored high-utilization patents, enabling companies to make informed R&D investment decisions (Erdogan et al., 2024). Collectively, these studies highlight the validity and practicality of using machine learning tools to measure and evaluate the intangible value of patent utilization proactively. These findings affirm the suitability of machine learning methods for assessing and predicting utilization metrics in related contexts.
A growing body of research has explored predictions using AutoML. For example, Feurer et al. (2015) demonstrated that AutoML can automate machine learning pipelines, significantly reducing the time required to construct models while enabling rapid iterative testing of models and hyperparameters (Feurer et al., 2015). Their findings indicate that AutoML often produces higher-performing predictive models compared to traditional manual methods. More recently, Ferreira (2024) evaluated the effectiveness of AutoML as a tool for supervised learning. A range of AutoML tools—including Auto-Keras, Auto-PyTorch, Auto-sklearn, AutoGluon, H2O AutoML, rminer, TPOT, and TransmogrifAI—was analyzed and their performance compared, underscoring the versatility and potential of AutoML technologies.
Regarding training data for machine learning, prior research has provided valuable insights. Studies on data characteristics suggest that tree-based algorithms are particularly well-suited for datasets containing a significant amount of categorical data. Additionally, with respect to data size, existing research has confirmed that larger training datasets typically lead to better classification performance compared to smaller datasets (Foody et al., 2006). Building on these prior studies, the present research adopts the AutoML approach to investigate the impact of training dataset composition on model performance. Specifically, it compares the performance of models trained on an aggregated dataset, which combines data from multiple disciplines, with models trained on datasets specific to each of the 16 disciplines. This comparison aims to determine whether differences in model performance are influenced by variations in the size of training data across these disciplines.
3. MATERIALS AND METHODS
3.1. Data
This study focuses on structured data provided by the Korean government through the OGD portal (data.go.kr) from 2012 to 2022. The metadata was collected and analyzed by categorizing the data into two utilization methods: download-based File Data and application programming interface (API)-based data. Metadata, which provides detailed descriptive information about data, was collected with a focus on classification systems, data descriptions, and other relevant attributes. Variables deemed unusable, such as contact names and phone numbers, were excluded from the analysis. To account for variations in data volume across the 16 administrative sectors defined by the scope of the Korean government’s tasks, the training datasets were divided into two categories: an integrated dataset, where data from all sectors were combined without categorization, and sector-specific datasets, where data were categorized according to the 16 sectors. For this study, the data was sourced from original datasets held within information systems operated by the South Korean government. From these sources, 16 domain-specific datasets were comprehensively pooled for use. The entire set of metadata items, as designated by the South Korean government’s administrative guidelines, was utilized for the analysis. Furthermore, in accordance with the research design, any records with missing metadata were consequently removed prior to conducting the analysis.
To ensure the reliability and robustness of the proposed predictive models, a systematic data cleansing and preprocessing pipeline was applied to the raw datasets. For the File Data, the initial dataset consisted of 88,027 records. A multi-stage filtering process was implemented to remove data unsuitable for model training and to guarantee data quality and consistency. First, records with missing values in the input variables were identified and excluded. Second, datasets that were discarded or rejected at the request of the providing OGD institution were removed. Finally, as this study’s scope is confined to OGD provided by the South Korean government up to the year 2022, all data registered after this cutoff were filtered out. This process resulted in a final analytical dataset of 44,648 records. As a specific example, the data for the Public Administration domain was refined from an initial 8,220 records to 6,051, with 2,169 records being removed. The API Data underwent an identical cleansing pipeline. The initial dataset of 13,444 records was preprocessed to yield a final analytical set of 6,677 records. For the Public Administration domain within the API Data, the record count was reduced from 1,787 to 876, with 911 records being excluded. Ultimately, approximately 50.7% of the original raw File Data and 49.7% of the original raw API Data were utilized for the final analysis.
3.1.1. Input Variables
Given the distinct metadata configurations inherent to different data access paradigms, this research constructed separate training datasets for File Data and API Data to accommodate their respective utilization patterns. File Data represents a download-based access model, while API Data enables real-time data retrieval through programmatic interfaces, necessitating differentiated feature engineering approaches. The File Data dataset comprises 37 variables, consisting of 23 continuous variables and 14 categorical variables. In contrast, the API Data dataset incorporates 42 variables, encompassing 23 continuous variables and 19 categorical variables. This asymmetric variable distribution reflects the additional metadata complexity associated with API-based data access mechanisms. Several variables are common to both data access modalities. The shared categorical variables include classification taxonomy, provider institution, usage license scope, research publication status, and fee structure. Common continuous variables encompass file size, data description length, keyword count within data descriptions, and null value frequency. These shared features capture fundamental data characteristics that transcend access methodology. API Data exhibits unique characteristics that necessitate additional variables specific to this access paradigm. API-specific categorical variables include detailed API type classification, API category designation, and open data center API provision status. These variables capture the technical and institutional dimensions unique to programmatic data access, reflecting the enhanced complexity of real-time data integration workflows compared to static file-based access patterns.
3.1.2. Target Variables
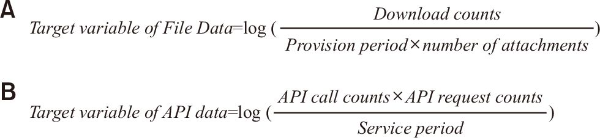
To establish target variables that quantitatively represent the utilization of OGD, indicators were designed to follow a normal distribution, ensuring better model performance (Hong et al., 2003; West et al., 1995). The normality of the distribution of each target variable was validated (Kwon et al., 2019). For File Data, the target variable was adjusted to account for the number of downloads over the provision period, incorporating corrections for cases where multiple files were provided as attachments. This adjustment reflects the concept of exploitation half-life, commonly used in the patent field, to account for the duration of data availability, as shown in Fig. 1A.
For API data, the target variables included the number of API calls and the number of applications utilizing the API. Similar to File Data, these variables were adjusted for the provision period to ensure consistency in measuring utilization. The normality of these variables was also checked to confirm their suitability for constructing indicators, as shown in Fig. 1B.
3.2. Proposed Methods
3.2.1. Automated Machine Learning Method
AutoML refers to a suite of tools designed to streamline the development of machine learning models by automating various stages of the process. These stages include data preprocessing, model selection, hyperparameter optimization, model evaluation, and deployment, minimizing the need for manual intervention. AutoML offers several advantages, such as accelerating the model development process by simplifying complex workflows and improving performance through automated hyperparameter tuning (Elshoky et al., 2022; Feurer et al., 2022).
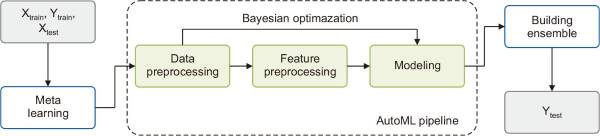
In this study, the Auto-sklearn library was utilized, an AutoML framework built on scikit-learn. Auto-sklearn systematically explores a range of machine learning algorithms—including SVM, Random Forest (RF), and k-Nearest Neighbors—to identify the model that best fits the data. Additionally, it employs Bayesian optimization, a probabilistic technique leveraging Gaussian Processes, to optimize hyperparameters efficiently and achieve superior performance with fewer iterations. Auto-sklearn also supports the construction of ensemble models, which combine predictions from multiple individual models to enhance overall performance (Feurer et al., 2022). Finally, a comparative analysis was conducted against a standalone RF model to directly evaluate the AutoML approach, followed by a SHapley Additive exPlanations (SHAP) value analysis to investigate the model’s feature importances.
Park (2022) employed Auto-sklearn to develop a machine learning model for predicting pollutant concentrations in rivers. The study demonstrated the potential of AutoML as an effective tool for forecasting pollution sources in environmental contexts through a comparative performance analysis (Park, 2022). Similarly, Angarita-Zapata et al. (2020) utilized Auto-sklearn to address the challenge of traffic prediction, demonstrating its effectiveness in accurately modeling traffic patterns and assessing the performance of network equipment. The mechanism of Auto-sklearn utilized in the literature and in this study is shown in Fig. 2.
3.2.2. Model Performance Evaluation
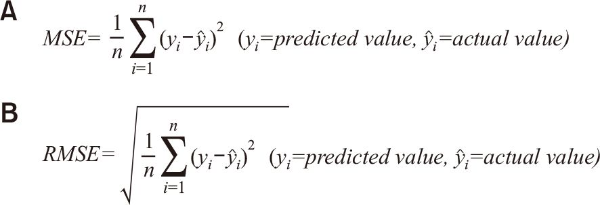
To assess model performance, this research utilized the mean squared error (MSE) and root mean squared error (RMSE) metrics. These metrics measure the magnitude of prediction errors, defined as the difference between predicted and actual values. While MSE is sensitive to outliers due to its squaring of errors, RMSE, which incorporates the square RMSE, provides a more intuitive interpretation of the average error magnitude as it retains the same units as the original data (Almalaq & Edwards, 2017; Aswin et al., 2018).
MSE, defined as the average of the squared differences between predicted and actual values, is particularly sensitive to large prediction errors. This sensitivity makes it useful for identifying models where significant outliers may exist. RMSE, on the other hand, is a scale-dependent error measure derived by taking the square root of MSE, making it less influenced by extreme values and more interpretable when evaluating average error size. RMSE tends to increase when predicting larger magnitude values and decrease for smaller magnitude predictions, offering a comprehensive understanding of model performance (Aswin et al., 2018).
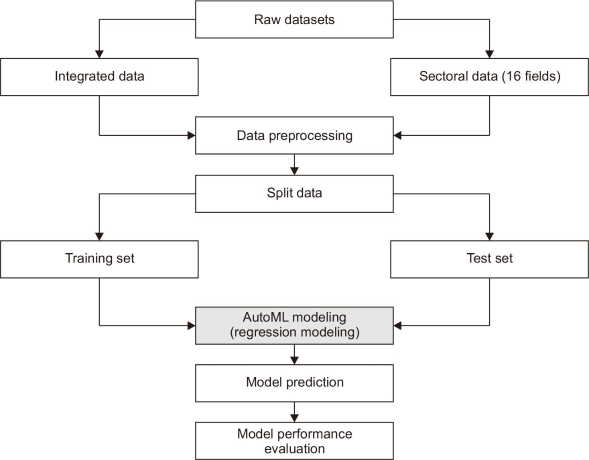
Both MSE and RMSE are widely employed in machine learning regression tasks to evaluate and train predictive models. The workflow for performance evaluation, including the calculation of MSE and RMSE, is presented in Fig. 3. A lower MSE or RMSE indicates superior predictive performance, and these metrics were integral to analysis of model accuracy and reliability (Almalaq & Edwards, 2017). Finally, the formulas for RMSE and MSE are shown in Fig. 4.
Fig. 3
Workflow for predicting the usability of open government data using automated machine learning model. AutoML, automated machine learning.
4. RESULTS
4.1. File Data
An analysis of the study results across File Data for 16 major taxonomies revealed notable differences in model performance between integrated and sector-specific training data. Analyzing the results in Table 1, for the education sector, models trained on integrated data achieved an RMSE of 0.684 and an MSE of 0.468, compared to an RMSE of 0.705 and an MSE of 0.497 for sector-specific data. These findings indicate better model performance with integrated data, as evidenced by lower error metrics and more accurate predictions. Similarly, 11 other sectors, including transportation and logistics (RMSE 0.695, MSE 0.484), agriculture and fisheries (RMSE 0.674, MSE 0.454), culture and tourism (RMSE 0.688, MSE 0.473), healthcare (RMSE 0.606, MSE 0.367), social welfare (RMSE 0.672, MSE 0.451), industry and employment (RMSE 0.685, MSE 0.469), disaster safety (RMSE 0.642, MSE 0.412), finance (RMSE 0.583, MSE 0.340), unification and diplomacy (RMSE 0.666, MSE 0.443), and environment and meteorology (RMSE 0.713, MSE 0.508), exhibited superior performance on integrated data.
Table 1
Model performance by 16 sectors (File Data)
| Item | ||||
|---|---|---|---|---|
| Field | Training data | |||
| Integrated data | Field data | |||
| Evaluation indicator | ||||
| RMSE | MSE | RMSE | MSE | |
| Public administration | 0.727 | 0.529 | 0.708 | 0.501 |
| Science and technology | 0.931 | 0.866 | 0.737 | 0.543 |
| Education | 0.684 | 0.468 | 0.705 | 0.497 |
| Transportation and logistics | 0.695 | 0.484 | 0.782 | 0.612 |
| Land management | 0.729 | 0.531 | 0.703 | 0.494 |
| Agriculture and fisheries | 0.674 | 0.454 | 0.687 | 0.472 |
| Culture and tourism | 0.688 | 0.473 | 0.732 | 0.535 |
| Law | 0.614 | 0.377 | 0.572 | 0.327 |
| Healthcare | 0.606 | 0.367 | 0.709 | 0.502 |
| Social welfare | 0.672 | 0.451 | 0.694 | 0.482 |
| Industry and employment | 0.685 | 0.469 | 0.702 | 0.492 |
| Food and health | 0.703 | 0.494 | 0.663 | 0.440 |
| Disaster safety | 0.642 | 0.412 | 0.805 | 0.648 |
| Finance | 0.583 | 0.340 | 0.585 | 0.342 |
| Unification and diplomacy | 0.666 | 0.443 | 0.674 | 0.455 |
| Environment and meteorology | 0.713 | 0.508 | 0.780 | 0.609 |
Conversely, in the public administration sector, the model performed better with sector-specific data (RMSE 0.708, MSE 0.501) than with integrated data (RMSE 0.727, MSE 0.529). A similar trend was observed in the science and technology sector, where sector-specific data led to improved performance (RMSE 0.737, MSE 0.543) compared to integrated data (RMSE 0.931, MSE 0.866). In addition to public administration and science and technology, five other sectors—including land management (RMSE 0.703, MSE 0.494), law (RMSE 0.572, MSE 0.327), and food and health (RMSE 0.663, MSE 0.440) showed better performance with sector-specific training data. Overall, RMSE values ranged from 0.583 to 0.934 for integrated data, reflecting a 1.60-fold variation in performance, and from 0.572 to 0.805 for sector-specific data, indicating a 1.41-fold difference. These results highlight a general trend where integrated data provides superior performance in certain domains, while sector-specific data yields better results in others. Additionally, the comparative analysis of MSE and RMSE—both of which are sensitive to error—reinforced these findings, further underscoring the influence of training data granularity on model performance.
4.2. API Data
An analysis of the study results using API Data across 16 major taxonomies revealed distinct differences in model performance between integrated and domain-specific training data. Analyzing the results in Table 2, for the science and technology sector, the model trained on integrated data achieved an RMSE of 4.569 and an MSE of 20.874, integrated to an RMSE of 4.801 and an MSE of 23.050 for domain-specific data. These results indicate that the integrated data yielded slightly lower errors and more accurate predictions. Similar trends were observed in 10 other sectors where integrated data outperformed domain-specific data, including education (RMSE 2.581, MSE 6.661), transportation and logistics (RMSE 3.932, MSE 15.460), agriculture and fisheries (RMSE 2.911, MSE 8.475), culture and tourism (RMSE 2.447, MSE 5.989), law (RMSE 2.011, MSE 4.046), healthcare (RMSE 2.332, MSE 5.437), industry and employment (RMSE 3.082, MSE 9.497), unification and diplomacy (RMSE 2.871, MSE 8.243), and environment and meteorology (RMSE 2.602, MSE 6.770).
Table 2
Model performance by 16 sectors (API Data)
| Item | ||||
|---|---|---|---|---|
| Field | Training data | |||
| Integrated data | Field data | |||
| Evaluation indicator | ||||
| RMSE | MSE | RMSE | MSE | |
| Public administration | 3.629 | 13.168 | 3.214 | 10.330 |
| Science and technology | 4.569 | 20.874 | 4.801 | 23.050 |
| Education | 2.581 | 6.661 | 2.587 | 6.693 |
| Transportation and logistics | 3.932 | 15.460 | 4.084 | 16.683 |
| Land management | 3.788 | 14.350 | 3.018 | 9.108 |
| Agriculture and fisheries | 2.911 | 8.475 | 3.215 | 10.336 |
| Culture and tourism | 2.447 | 5.989 | 2.637 | 6.956 |
| Law | 2.011 | 4.046 | 4.136 | 17.105 |
| Healthcare | 2.332 | 5.437 | 2.567 | 6.589 |
| Social welfare | 2.772 | 7.686 | 2.262 | 5.116 |
| Industry and employment | 3.082 | 9.497 | 3.420 | 11.694 |
| Food and health | 2.825 | 7.979 | 2.782 | 7.738 |
| Disaster safety | 2.899 | 8.403 | 2.398 | 5.749 |
| Finance | 4.679 | 21.895 | 3.233 | 10.451 |
| Unification and diplomacy | 2.871 | 8.243 | 3.122 | 9.748 |
| Environment and meteorology | 2.602 | 6.770 | 2.985 | 8.913 |
Conversely, in the public administration sector, domain-specific data produced better results, with an RMSE of 3.214 and an MSE of 10.330 compared to an RMSE of 3.629 and an MSE of 13.168 for integrated data. A similar pattern was observed in the land management sector, where domain-specific data outperformed integrated data with an RMSE of 3.018 and an MSE of 9.108, compared to an RMSE of 3.788 and an MSE of 14.350. In addition to public administration and land management, six other sectors—social welfare (RMSE 2.262, MSE 5.116), food and health (RMSE 2.782, MSE 7.738), disaster safety (RMSE 2.398, MSE 5.749), and finance (RMSE 3.233, MSE 10.451) demonstrated better performance with domain-specific training data. Overall, RMSE values for models trained on integrated data ranged from 2.011 to 4.569, reflecting a performance difference of approximately 2.27. For domain-specific data, RMSE values ranged from 2.262 to 4.801, indicating a performance difference of approximately 2.12. A similar trend was observed with MSE and RMSE metrics, which are particularly sensitive to error, further reinforcing the performance variations between integrated and domain-specific training approaches.
4.3. Comparative Performance Analysis of AutoML and Random Forest Model (File Data)
To evaluate the suitability of an AutoML-based approach, this study conducts a comparative performance analysis against a standard RF model. The evaluation utilizes RMSE and MSE as performance metrics, with results measured separately for models trained on integrated and domain-specific (field) data. The experimental results for the RF model are presented in Table 3, and the performance delta between the two approaches is summarized in Table 4. The empirical results indicate that the AutoML-based models generally outperformed the standalone RF models, achieving lower prediction errors (RMSE and MSE) across most test cases. For instance, in the Public administration domain, the AutoML model trained on domain-specific data achieved an RMSE of 0.708, a notable improvement over the RF model’s RMSE of 0.735, corresponding to a performance gain of approximately 0.027. This suggests that AutoML’s automated optimization process enables a more precise capture of complex patterns inherent in the domain-specific data.
Table 3
Random forest model performance by 16 sectors (File Data)
| Item | ||||
|---|---|---|---|---|
| Field | Training data | |||
| Integrated data | Field data | |||
| Evaluation indicator | ||||
| RMSE | MSE | RMSE | MSE | |
| Public administration | 0.745 | 0.556 | 0.735 | 0.541 |
| Science and technology | 0.891 | 0.793 | 0.769 | 0.592 |
| Education | 0.692 | 0.478 | 0.727 | 0.528 |
| Transportation and logistics | 0.733 | 0.538 | 0.794 | 0.631 |
| Land management | 0.731 | 0.534 | 0.708 | 0.501 |
| Agriculture and fisheries | 0.694 | 0.482 | 0.700 | 0.491 |
| Culture and tourism | 0.732 | 0.535 | 0.762 | 0.581 |
| Law | 0.620 | 0.385 | 0.611 | 0.374 |
| Healthcare | 0.660 | 0.435 | 0.723 | 0.523 |
| Social welfare | 0.697 | 0.486 | 0.695 | 0.483 |
| Industry and employment | 0.705 | 0.497 | 0.717 | 0.515 |
| Food and health | 0.738 | 0.544 | 0.720 | 0.518 |
| Disaster safety | 0.672 | 0.451 | 0.814 | 0.663 |
| Finance | 0.600 | 0.360 | 0.592 | 0.350 |
| Unification and diplomacy | 0.689 | 0.475 | 0.682 | 0.465 |
| Environment and meteorology | 0.727 | 0.528 | 0.776 | 0.601 |
Table 4
Performance comparison of AutoML and random forest model (File Data)
| Item | ||||
|---|---|---|---|---|
| Field | Training data | |||
| Integrated data | Field data | |||
| Evaluation indicator | ||||
| RMSE | MSE | RMSE | MSE | |
| Public administration | -0.01849 | -0.02676 | -0.02746 | -0.03990 |
| Science and technology | 0.04036 | 0.07276 | -0.03232 | -0.04885 |
| Education | -0.00760 | -0.01031 | -0.02193 | -0.03143 |
| Transportation and logistics | -0.03839 | -0.05386 | -0.01249 | -0.01921 |
| Land management | -0.00185 | -0.00314 | -0.00476 | -0.00693 |
| Agriculture and fisheries | -0.02018 | -0.02789 | -0.01341 | -0.01857 |
| Culture and tourism | -0.04355 | -0.06217 | -0.03015 | -0.04587 |
| Law | -0.00648 | -0.00800 | -0.03949 | -0.04692 |
| Healthcare | -0.05387 | -0.06843 | -0.01414 | -0.02093 |
| Social welfare | -0.02504 | -0.03487 | -0.00110 | -0.00117 |
| Industry and employment | -0.01969 | -0.02759 | -0.01541 | -0.02267 |
| Food and health | -0.03475 | -0.05027 | -0.05671 | -0.07798 |
| Disaster safety | -0.02954 | -0.03897 | -0.00899 | -0.01459 |
| Finance | -0.01700 | -0.02000 | -0.00660 | -0.00799 |
| Unification and diplomacy | -0.02315 | -0.03192 | -0.00813 | -0.01030 |
| Environment and meteorology | -0.01368 | -0.02006 | 0.00448 | 0.00756 |
However, the superiority of AutoML was not universal. An exceptional case was observed in the science and technology domain, where the RF model trained on integrated data yielded a lower RMSE (0.891) than its AutoML counterpart (0.931). Nevertheless, for this specific domain, the highest performance was achieved when models were trained on domain-specific data, a scenario in which the AutoML approach demonstrated superior results. Therefore, the application of AutoML is still considered appropriate and beneficial in this context. In aggregate, the experimental findings provide empirical evidence that an AutoML approach, which automates the complex processes of model selection and hyperparameter tuning, represents a more effective and robust alternative to employing a single, manually configured model for the task of predicting public data utilization.
4.4. Feature Importance
4.4.1. File Data
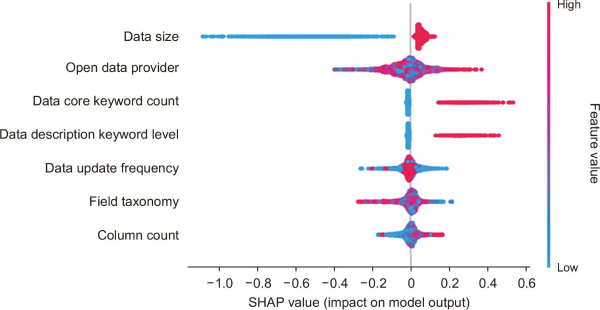
An analysis of feature contributions to the target variable, conducted via SHAP values, reveals that data size exerts a decisive influence on the model’s predictions. The distribution of SHAP values for this feature was observed to be asymmetric; it is relatively narrow and concentrated in the positive region, while being markedly wide and dispersed in the negative region. This characteristic implies that an increase in data size does not proportionally induce a sharp rise in the predicted value. Instead, the analysis empirically confirms a clear and consistent negative relationship between File Data size and its utilization. The prevalence of blue points (low feature values) in the negative SHAP region indicates that as data size diminishes, the predicted utilization correspondingly decreases. This pattern can be interpreted to mean that a minimum threshold of data size is necessary to ensure a baseline level of practical value.
For the open data provider, interpretation must account for its nature as a categorical variable. Unlike with continuous variables, the color gradient across points does not represent a numerical or ordinal relationship but rather reflects the qualitative differences and unique characteristics of each distinct provider. The wide dispersion of SHAP values across both positive and negative domains clearly indicates that the impact of a provider’s unique organizational characteristics on the target variable is highly heterogeneous. This suggests that while some providers act as positive catalysts for data utilization, others may exert a limited or even detrimental influence.
The data core keyword count feature exhibits a pattern consistent with theoretical expectations, demonstrating a clear positive impact on the predicted outcome. The dense concentration of red points (high feature values) in the positive SHAP region empirically substantiates the existence of a robust and consistent positive correlation between an increase in the number of core keywords and a corresponding rise in the predicted utilization value. A detailed visualization of this SHAP value analysis for all input variables is presented in Fig. 5, which illustrates the relative importance and directional contribution of each feature.
4.4.2. API Data
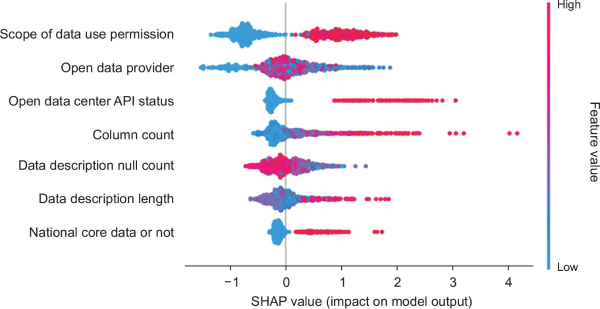
An analysis of the SHAP values for the API Data model identified the Scope of data use permission as the most powerful and decisive predictive feature. This indicates that the utilization of API data is strongly contingent on the permissiveness of its usage rights. The SHAP value distribution reveals a distinct pattern: Red points, representing a broader scope of permission, are concentrated in the positive region, while blue points, representing a more restrictive scope, are concentrated in the negative region. This color-based distribution confirms that as the scope of data use expands, the predicted utilization value shows a statistically significant increase. Conversely, a more restrictive scope corresponds to a substantial decrease in the prediction.
Consistent with the analysis of File Data, the open data provider feature must be interpreted as a categorical variable, where color variations reflect qualitative differences between providers rather than a numerical scale. The wide dispersion of SHAP values across both positive and negative domains suggests that the influence of each provider is highly heterogeneous. In effect, some organizations act as positive catalysts, promoting the use of their API Data, while others have a more limited or even a detrimental impact on utilization.
The analysis of the open data center API status feature revealed a clear tendency for APIs provided directly by the central open data center to be associated with relatively high prediction values. This can be interpreted as evidence that the standardized governance framework and consistent service quality of a central authority contribute to higher user confidence and a greater willingness to utilize the data.
The Data description null count feature was found to have a bidirectional and complex influence on the model, with its SHAP values distributed across a wide range in both positive and negative territories. A noteworthy inverse relationship was observed: Red points, indicating a high number of null values, were concentrated in the negative SHAP region, while blue points, indicating fewer null values, were predominant in the positive region. This pattern suggests that an increase in missing values within the data description significantly decreases the predicted utilization. Conversely, a lower null count, signifying greater data completeness, leads to a corresponding increase in the prediction. The summary plot for this SHAP value analysis is presented in Fig. 6.
5. DISCUSSION
As an alternative approach to proactively evaluate the utilization of OGD, this study developed a prediction model using an AutoML technique. The model was trained using metadata from accumulated OGD, with performance compared based on the classification of training data. The training data was categorized into integrated data and domain-specific data, considering the attributes of OGD (such as field and utilization method) and classified across 16 taxonomy systems. The results demonstrated that the models and methods yielding the best performance varied according to data attributes, aligning with previous research emphasizing the importance of considering data properties, which can significantly influence performance outcomes (Si et al., 2024). In terms of the implications for different utilization methods of OGD (File Data, API Data), API Data exhibited a broader range of performance indicators due to the wider distribution of target variables. This finding supports prior studies indicating that model performance is contingent on the characteristics of the independent and dependent variables in the data (Satoła & Satoła, 2024; Zhang & Zhu, 2022). Conversely, File Data outperformed API Data in terms of RMSE and MSE metrics, suggesting that File Data offers superior overall performance in predictive tasks.
While the integrated training approach demonstrated superior performance across a majority of domains, the exceptional result where domain-specific models outperformed in particular sectors warrants a deeper analysis. This anomalous phenomenon, where a model trained on a smaller, more focused dataset surpassed one trained on a larger, more diverse dataset, suggests that the principle of more data is always better is not universally applicable. This phenomenon appears to be attributable to the highly idiosyncratic characteristics present in these domains, a condition that can be hypothesized as negative transfer in machine learning.
Negative transfer refers to a scenario where the learning process on integrated data is adversely affected (Pan & Yang, 2010). In such cases, the integrated model, while learning general patterns from the aggregate data, may also learn patterns and noise that directly conflict with the specific logic of these particular domains. The domain-specific model, by contrast, is not exposed to this irrelevant or contradictory information, allowing it to optimize exclusively for the distinct patterns of its own domain (Weiss et al., 2016).
Furthermore, the success of domain-specific models in these particular sectors empirically demonstrates that the effectiveness of a data integration strategy is conditional upon the degree of underlying similarity between the domains being combined. Future research should involve a deeper feature-level analysis of these exceptional sectors to precisely identify the unique characteristics that cause this negative transfer effect, thereby enabling the development of more adaptive and selective data integration strategies.
The superior performance of models trained on integrated datasets compared to domain-specific models can be understood through the theoretical framework of transfer learning. Pan and Yang (2010) demonstrated that multi-domain trained models can enhance performance within individual domains by learning shared representations across disparate data sources. These results suggest that the rich feature space provided by integrated datasets can compensate for the limited characteristics inherent to individual domains, thereby enabling the construction of more robust predictive models. The effectiveness of integrated datasets is fundamentally linked to the critical importance of data diversity in machine learning systems. Torralba and Efros (2011) established that models trained on large-scale, diverse datasets exhibit superior generalization performance even within specific domains, a finding that aligns with empirical results. Within the open data context, integration across multiple domains appears to mitigate domain-specific biases while facilitating more balanced feature learning processes. From the perspective of feature representation learning in deep learning and AutoML frameworks, integrated datasets provide an environment conducive to learning richer, multi-layered feature representations. As demonstrated by Bengio et al. (2013), diverse domain data promotes hierarchical feature learning, enabling effective acquisition of both low-level common features and high-level domain-specific characteristics. The convergence of these findings across disparate application domains underscores the fundamental value of data integration strategies in advancing machine learning model performance and generalizability.
This study’s findings contribute not only to the field of machine learning but also offer significant insights into the theoretical understanding of information utilization in digital government contexts. The consistently superior performance of models trained on integrated datasets can be framed within the established principles of Information Triangulation Theory. This theory posits that synthesizing information from multiple, diverse sources leads to a more robust and reliable understanding than relying on a single source. This research provides an empirical validation of this concept in a computational setting, demonstrating that the triangulation of data from various government domains enhances the predictive accuracy of OGD utilization. Rather than viewing information diversity purely as a computational optimization problem, these results suggest it is a fundamental principle for understanding and predicting information value in complex ecosystems.
The empirical evidence aligns with this theoretical framing. For File Data, models trained on integrated data demonstrated superior performance across most domains, with exceptions noted in highly specialized fields like public administration and science and technology. A similar trend was observed for API Data, where the integrated approach proved more effective in a majority of fields. These results suggest that while domain-specific characteristics are important, the broader context provided by an integrated dataset often contains richer signals that lead to more generalizable and robust predictive models. This finding directly supports the core tenet of Information Triangulation: that an aggregation of diverse perspectives, or in this case, data sources yields a more comprehensive and accurate assessment.
From a machine learning perspective, this phenomenon is consistent with the principles of transfer learning, where knowledge gained from multiple domains enhances performance on a specific task. As established by Pan and Yang (2010), models trained on diverse data sources can learn shared representations that compensate for the limited information within any single domain. The integrated datasets in this study likely facilitate a more balanced feature learning process, mitigating domain-specific biases and allowing the models to identify cross-domain patterns that are crucial for prediction. This provides a computational mechanism that validates the principles of Information Triangulation, bridging information science theory with machine learning practice.
Therefore, this research challenges the conventional focus of AutoML research on single-dataset performance optimization. The findings suggest that the process of data integration and selection should be considered a core component of the AutoML pipeline itself, a perspective that expands on the framework articulated by Hutter et al. (2019). By demonstrating that cross-domain interactions can be more consequential for predictive accuracy than single-domain features, this work highlights a critical, and often overlooked, phase in the AutoML workflow.
6. CONCLUSION
The academic significance of this study is its empirical validation that AutoML can serve as an effective tool for measuring and evaluating the intangible value of OGD utilization. By building and comparing the performance of AutoML models, this study demonstrated an alternative assessment approach not previously explored, addressing limitations in prior research. Furthermore, the results established the importance of tailoring the application of training data based on the attributes of OGD, such as field and utilization method. From a practical perspective, this study’s framework enables OGD providers to proactively diagnose and evaluate data usage, allowing them to more effectively align data supply with user demand.
This study confirmed the technical feasibility of applying AutoML to predict OGD utilization and presented a systematic approach to assessing the potential value of public datasets. The primary finding is that the training data strategy—specifically, the choice between an integrated or domain-specific approach—is a critical factor influencing predictive performance. Models trained on integrated data sources outperformed domain-specific models in 11 of 16 File Data sectors and 10 of 16 API Data sectors. This result confirms that moving beyond domain-specific silos enhances predictive accuracy, a finding that aligns with established principles in machine learning regarding the benefits of diverse training sets.
From a practical standpoint, this research provides a framework that OGD providers can use for the proactive evaluation of data assets, enabling a more effective alignment of data supply with user demand. However, this study is subject to certain limitations.
Furthermore, it is important to acknowledge the inherent assumptions of the proposed approach. The use of download and API call metrics serves as a proxy for utilization, which may not fully capture the more nuanced concepts of true societal value or impact. The findings are also derived exclusively from the South Korean OGD context, and their generalizability to other governmental data ecosystems requires further investigation. Future research would be significantly strengthened by incorporating qualitative validation with end-users to provide a richer understanding of the factors that drive meaningful data adoption beyond simple access metrics.
Ultimately, this work advances the application of computational methods within information science. It presents a viable, data-driven methodology for prospectively evaluating information systems, shifting the focus from traditional retrospective metrics toward a forward-looking assessment of a dataset’s potential value. By establishing an empirical basis for data strategy and governance, the findings offer a concrete methodology for policymakers and data scientists seeking to maximize the impact of open data initiatives.
REFERENCES
, , (2019) M-shaped rational solitons and their interaction with kink waves in the Fokas-Lenells equation Physica Scripta, 94, 055205 https://doi.org/10.1088/1402-4896/ab0455.
, , , , , , 2017 16th IEEE International Conference on Machine Learning and Applications (ICMLA) IEEE A review of deep learning methods applied on load forecasting, 2017, December 18-21, pp. 511-516, https://doi.org/10.1109/ICMLA.2017.0-110
, , , , , , , , , Information Processing and Management of Uncertainty in Knowledge-Based Systems (IPMU 2020) Springer Cham General-purpose automated machine learning for transportation: A case study of Auto-sklearn for traffic forecasting, 2020, June 15-19, pp. 728-744, https://doi.org/10.1007/978-3-030-50143-3_57 Article Id (pmcid)
, , (2018) Paper presented at 2018 International Conference on Communication and Signal Processing (ICCSP) Melmaruvathur, India Deep learning models for the prediction of rainfall, https://doi.org/10.1109/ICCSP.2018.8523829
, (2023) An AutoML-driven antenna performance prediction model in the autonomous driving radar manufacturing process KSII Transactions on Internet and Information Systems, 17, 3330-3344 https://doi.org/10.3837/tiis.2023.12.006.
, , (2013) Representation learning: A review and new perspectives IEEE Transactions on Pattern Analysis and Machine Intelligence, 35, 1798-1828 https://doi.org/10.1109/TPAMI.2013.50.
, (2006) Access to public-sector information in Europe: Policy, rights, and obligations The Information Society, 22, 13-24 https://doi.org/10.1080/01972240500388180.
, , (2015) Open data, privacy, and fair information principles: Towards a balancing framework https://ssrn.com/abstract=2695005
(2009) The research act: A theoretical introduction to sociological methods Routledge https://doi.org/10.4324/9781315134543 Article Id (pmcid)
, , , (2022) Comparing automated and non-automated machine learning for autism spectrum disorders classification using facial images ETRI Journal, 44, 613-623 https://doi.org/10.4218/etrij.2021-0097.
, , (2024) Predicting patent quality based on machine learning approach IEEE Transactions on Engineering Management, 71, 3144-3157 https://doi.org/10.1109/TEM.2022.3207376.
, , , (2006) Training set size requirements for the classification of a specific class Remote Sensing of Environment, 104, 1-14 https://doi.org/10.1016/j.rse.2006.03.004.
, , (2016) The sharing economy: Why people participate in collaborative consumption Journal of the Association for Information Science and Technology, 67, 2047-2059 https://doi.org/10.1002/asi.23552.
, , , (2021) Strategic analysis of providing corporate sustainability open data Intelligent Systems in Accounting, Finance and Management, 28, 195-214 https://doi.org/10.1002/isaf.1501.
, , (2003) Testing configural, metric, scalar, and latent mean invariance across genders in sociotropy and autonomy using a non-Western sample Educational and Psychological Measurement, 63, 636-654 https://doi.org/10.1177/0013164403251332.
(2014) A study on the invigorating strategies for open government data Journal of the Korean Data and Information Science Society, 25, 769-777 https://doi.org/10.7465/jkdi.2014.25.4.769.
, , (2019) Automated machine learning: Methods, systems, challenges Springer Cham https://doi.org/10.1007/978-3-030-05318-5
, , (2012) Benefits, adoption barriers and myths of open data and open government Information Systems Management, 29, 258-268 https://doi.org/10.1080/10580530.2012.716740.
, (2014) Infomediary business models for connecting open data providers and users Social Science Computer Review, 32, 694-711 https://doi.org/10.1177/0894439314525902.
, , (2017) Visualising forecasting algorithm performance using time series instance spaces International Journal of Forecasting, 33, 345-358 https://doi.org/10.1016/j.ijforecast.2016.09.004.
(2023) A study on the improvement of the legal system for the promotion of opening and utilization of open government data - Focusing on cases of refusal to provide - Informatization Policy, 30, 46-67 https://doi.org/10.22693/NIAIP.2023.30.2.046.
, , , (2023) A decade of open data policy research using big data analytics techniques: Focusing on comparative analysis by regime Public Policy Review, 37, 45-67 https://doi.org/10.17327/ippa.2023.37.4.003.
, (2020) Recent trends of the amendment of the public sector information directive in EU and its implications to the Republic of Korea SungKyunKwan Law Review, 32, 1-30 https://doi.org/10.17008/skklr.2020.32.1.001.
, , , , , , 2017 IEEE 19th Conference on Business Informatics (CBI) IEEE Business models for open data ecosystem: Challenges and motivations for entrepreneurship and innovation, 2017, July 24-27, pp. 398-407, https://doi.org/10.1109/CBI.2017.51
, , (2012) Risk estimation and risk prediction using machine-learning methods Human Genetics, 131, 1639-1654 https://doi.org/10.1007/s00439-012-1194-y. Article Id (pmcid)
, , (2019) Stacking ensemble technique for classifying breast cancer Healthcare Informatics Research, 25, 283-288 https://doi.org/10.4258/hir.2019.25.4.283. Article Id (pmcid)
, , , (2021) Predicting potential occurrence of pine wilt disease based on environmental factors in South Korea using machine learning algorithms Ecological Informatics, 64, 101378 https://doi.org/10.1016/j.ecoinf.2021.101378.
(2020) Forecasting open government data demand using keyword network analysis Informatization Policy, 27, 24-46 https://doi.org/10.22693/NIAIP.2020.27.4.024.
, , (2018) Impact of e-government development on the level of corruption: Measuring the effects of related indices in time and dimensions Review of Economic Perspectives, 18, 99-121 https://doi.org/10.2478/revecp-2018-0006.
(2023) Digital transformation education, opportunities, and challenges of the application of ChatGPT to emerging economies Education Research International, 2023, 7605075 https://doi.org/10.1155/2023/7605075.
(2012) Paper presented at the 4th Annual ACM Web Science Conference Evanston, Illinois Transparency, open data and trust in government: Shaping the infosphere, https://doi.org/10.1145/2380718.2380747
, , , , , (2017) Paper presented at the 18th Annual International Conference on Digital Government Research Staten Island, NY, USA Usability evaluation of an open data platform, https://doi.org/10.1145/3085228.3085315
, (2010) A survey on transfer learning IEEE Transactions on Knowledge and Data Engineering, 22, 1345-1359 https://doi.org/10.1109/TKDE.2009.191.
(2022) Development of a model to predict water quality using an automated machine learning algorithm Journal of the Korean Society of Water and Wastewater, 36, 329-337 https://doi.org/10.11001/jksww.2022.36.6.329.
(2011) When transparency and collaboration collide: The USA open data program Journal of the American Society for Information Science and Technology, 62, 2085-2094 https://doi.org/10.1002/asi.21622.
, , , (2019) Paper presented at the Thirty-Third AAAI Conference on Artificial Intelligence and Thirty-First Innovative Applications of Artificial Intelligence Conference and Ninth AAAI Symposium on Educational Advances in Artificial Intelligence Honolulu, Hawaii, USA Regularized evolution for image classifier architecture search, https://doi.org/10.1609/aaai.v33i01.33014780
, (2024) Performance comparison of machine learning models used for predicting subclinical mastitis in dairy cows: Bagging, boosting, stacking, and super-learner ensembles versus single machine learning models Journal of Dairy Science, 107, 3959-3972 https://doi.org/10.3168/jds.2023-24243.
, , , , (2024) Interactive effects of hyperparameter optimization techniques and data characteristics on the performance of machine learning algorithms for building energy metamodeling Case Studies in Thermal Engineering, 55, 104124 https://doi.org/10.1016/j.csite.2024.104124.
, , , , , , , , The 19th ACM SIGKDD International Conference on Knowledge Discovery and Data Mining KDD Auto-WEKA: Combined selection and hyperparameter optimization of classification algorithms, 2013, August 11-14, pp. 847-855, https://doi.org/10.1145/2487575.2487629
, , , , , Conference on Computer Vision and Pattern Recognition (CVPR) 2011 IEEE Unbiased look at dataset bias, 2011, June 20-25, pp. 1521-1528, https://doi.org/10.1109/CVPR.2011.5995347
, , , , (2017) Open data and its usability: An empirical view from the citizen's perspective Information Systems Frontiers, 19, 285-300 https://doi.org/10.1007/s10796-016-9679-1.
, , (2016) A survey of transfer learning Journal of Big Data, 3, 9 https://doi.org/10.1186/s40537-016-0043-6.
, , , (2016) A patent quality analysis and classification system using self-organizing maps with support vector machine Applied Soft Computing, 41, 305-316 https://doi.org/10.1016/j.asoc.2016.01.020.
, (2019) An analysis of open data policy in Korea: Focused on national core data in open data portal Korean Public Management Review, 33, 219-247 https://doi.org/10.24210/kapm.2019.33.1.010.
, (2022) Stacking model for photovoltaic-power-generation prediction Sustainability, 14, 5669 https://doi.org/10.3390/su14095669.
, , (2005) Exploring stakeholders' expectations of the benefits and barriers of e‐government knowledge sharing Journal of Enterprise Information Management, 18, 548-567 https://doi.org/10.1108/17410390510624007.
, (2017) Neural architecture search with reinforcement learning https://arxiv.org/abs/1611.01578