Introduction
Rapid urbanization and climate change are intensifying environmental and social pressures on cities worldwide. Globally, more than half of the world’s population now resides in urban areas, and this proportion is projected to reach approximately 68% by 2050 (United Nations, 2019). As urban populations continue to increase, expanding built-up areas accelerate the conversion of permeable surfaces into impervious ones, reducing infiltration and increasing runoff (Ongaga et al., 2024; Wu et al., 2020). The decline in urban green spaces and water bodies exacerbates multiple socio-environmental challenges, including the urban heat island effect, heightened flood risk, deteriorating air quality, and the loss of biodiversity (Saiz-Rodríguez et al., 2021).
Given these growing pressures, the International Union for Conservation of Nature (IUCN, 2016) identifies seven key societal challenges: (1) climate change mitigation and adaptation, (2) disaster risk reduction, (3) economic and social development, (4) human health, (5) food security, (6) water security, and (7) environmental degradation and biodiversity loss. To address these multifaceted challenges, nature-based solutions (NbS) have gained significant global attention. According to the IUCN (2016), NbS are defined as “actions that protect, sustainably manage, or restore natural or modified ecosystems to address societal challenges in an effective and adaptive manner, while simultaneously delivering benefits for human well-being and biodiversity.” Although formally defined only recently, the underlying principles—such as wetland restoration, riparian conservation, and the integration of vegetation into urban design—have long been embedded in ecological management and landscape planning practices.
NbS encompass a broad and inclusive framework consisting of three major categories: (1) existing natural or protected ecosystems, (2) sustainably managed or restored ecosystems, and (3) newly created ecosystems. While this framework covers a wide range of approaches across different landscapes, this review focuses specifically on green and blue space (GBS)–based NbS within urban environments. These interventions—including parks, urban forests, waterways, wetlands, and constructed green infrastructure systems—represent some of the most widely implemented NbS strategies in cities.
The international community has also increasingly highlighted the expansion and restoration of urban GBS as a core component of sustainable urban development. The Kunming–Montreal Global Biodiversity Framework, adopted in 2022, establishes 23 global targets to be achieved by 2030; among these, Target 12 explicitly calls for enhanced access to GBS in urban areas (CBD, 2022), emphasizing the essential role of urban ecosystems in strengthening climate resilience and improving human well-being.
Despite the growing global emphasis on the importance of NbS, clear guidance on what makes an NbS effective and how such strategies should be designed and implemented in practice remains limited (IUCN, 2020). Rather than simply increasing the quantity of GBS, cities need a deeper understanding of how these measures should be strategically applied to address specific urban challenges. Accordingly, this study reviews a wide range of empirical research to examine evidence-based NbS applications, with particular emphasis on two of the IUCN’s societal challenges: (1) climate change mitigation and adaptation, focusing on urban heat reduction, and (2) disaster risk reduction, focusing on flood mitigation. This research aims to synthesize quantitative evidence and to identify design and implementation strategies that maximize the effectiveness of urban GBS measures for climate resilience.
Materials and Methods
This research conducted a systematic literature review targeting peer-reviewed academic papers and official reports from international organizations published during the 2010-2025 period. Key databases (Web of Science, Scopus, PubMed, Google Scholar) were utilized, searching with the keywords “Urban green spaces", “Nature-based Solutions", “GBS", “Flood risk reduction", “Cooling effect", “Biodiversity", and “Climate Adaptation." The literature selection criteria were limited to studies presenting quantitative effects of urban green spaces and NbS. Out of a total of 157 papers, 20 core documents were ultimately selected for analysis (Fig. 1).
Results
Cooling effects of urban green and blue spaces
Evidence from ten key studies shows that urban GBS contribute meaningfully to surface temperature reduction (Table 1). Overall, the reviewed literature indicates that cooling performance is influenced by multiple factors including patch size, vegetation structure, and surrounding land-use characteristics among others.
One of the most consistent determinants of cooling effect is the size of green spaces, with most empirical studies indicating that larger patches exhibit both higher cooling intensity and wider spatial cooling reach. An analysis of 92 parks in Japan by Cao et al. (2010) showed that parks smaller than 2 ha produced little to no cooling, whereas meaningful cooling emerged only beyond this threshold. In particular, parks larger than 10 ha displayed the strongest cooling effects. Similarly, Monteiro et al. (2016), examining eight greenspaces in the United Kingdom, reported that very small parks (<0.5 ha) generated minimal cooling of about 0.3°C and exhibited virtually no cooling beyond their boundaries. Small parks (0.8-3.8 ha) cooled surrounding areas by roughly 0.4-0.8°C, while medium parks (10-12 ha) produced stronger cooling of 0.6-1.0°C and extended their influence over distances of 180-330 m. However, increases in park size do not yield unlimited gains. Du et al. (2017), analyzing 68 parks in Shanghai, identified a diminishing marginal effect around 40 ha, beyond which additional area provided limited extra cooling.
Vegetation structure also strongly influenced the magnitude of urban cooling. Overall, tree-dominated green spaces exhibited substantially greater temperature-reduction effects than shrub- or grass-dominated areas (Cao et al. 2010; Chang & Li, 2014; Feyisa et al., 2014). For example, Bowler et al. (2010) noted that several included studies reported stronger cooling effects in parks with substantial tree cover compared with grass-dominated areas. Feyisa et al. (2014) found that land-surface temperature decreased by approximately 0.02°C for every 1% increase in canopy cover, demonstrating that higher canopy density substantially enhances local cooling. Similarly, Hamada and Ohta (2010) reported a strong negative correlation between forest-cover ratio (within 200 m) and daytime air temperature, suggesting that greater forest cover effectively mitigates urban heat. Regarding species composition, broadleaf trees were generally more effective than conifers. Feyisa et al. (2014) found that Eucalyptus spp. provided the strongest cooling, while Cupressus and Grevillea (coniferous and semi-evergreen species) were less effective. Hamada and Ohta (2010) observed that mixed deciduous–evergreen stands within the study park exhibited higher specific humidity in summer, which contributed to daytime cooling.
The cooling performance of GBS is also influenced by the characteristics of adjacent land-use types. Yu et al. (2017) found that green spaces adjacent to or connected with water bodies showed a markedly enhanced cooling effect compared with green-only areas. Green–blue combinations reduced land surface temperatures by about 6.38°C relative to built-up areas, which is nearly 3°C stronger than the cooling observed in green spaces without water adjacency, and they also exhibited larger cooling extents and intensities. Similarly, Chen et al. (2014) reported that larger green patches and a higher proportion of neighboring green areas were associated with stronger surface urban cool island effects. Among green types, rivers and lakes exhibited the most pronounced cooling, and tree-dominated patches were consistently cooler than areas dominated by shrubs or grass.
Green and blue spaces contributions to urban flood mitigation
Urban GBS are widely utilized in urban areas as effective measures for flood mitigation. Following the micro-, meso-, and macro-scale classification proposed by Esraz-Ul-Zannat et al. (2024), this review organizes ten representative papers accordingly to examine how different types of NbS contribute to urban flood mitigation across spatial scales (Table 2).
Micro-scale GBS, including blue roofs, green roofs, green walls, permeable pavements, and rainwater harvesting, function primarily at the building or block level to directly reduce stormwater runoff. Across the reviewed studies, these measures consistently demonstrated substantial improvements in drainage performance. For example, Song et al. (2019) reported that implementing LID-type GBS across a 37.68 km² area in Shenzhen increased absorption duration, enhanced recovery capacity from 76.38-98.19%, and eliminated flooding in 35% of previously flooded areas. For blue–green roofs, Richter and Dickhaut (2023) reported that these systems retained 64-74% of rainfall, reduced peak runoff to extremely low levels (Cp=0.02-0.04), and delayed discharge for several hours. For green walls, Palermo et al. (2023) found that a modular living wall system performed robustly under 32 simulated rainfall events, with runoff coefficients spanning 0-81.6% and outflow initiation delayed by 4-35 minutes. Such performance indicates that even individual micro-scale units can exert measurable influence on stormwater behavior during storm events.
Meso-scale GBS operate at the neighborhood or sub-catchment scale and include systems such as swales, green streets, infiltration trenches, rain gardens, detention ponds, retention ponds, and sand filters. These GBS elements extend hydrological regulation beyond the immediate installation site by reducing peak flows, enhancing infiltration, and stabilizing runoff dynamics across connected urban drainage networks. The reviewed studies consistently show that meso-scale measures provide substantial buffering capacity during storm events. For example, Giermek (2015) showed that small urban wetlands in Cape Town reduced peak flows by up to 42% during flash events and approximately 20% during longer-duration storms. Laub et al. (2024) further showed that two small bioretention basins in Texas reduced peak flow by approximately 77-83% on average and decreased hydrograph flashiness by 83-93%. In the case of rain gardens, Jeon et al. (2021) showed that the system maintained a consistent 88% reduction in runoff over a five-year monitoring period. These results suggest that meso-scale bioretention facilities can provide long-term, stable buffering capacity under repeatedly occurring storm events in real urban environments.
Macro-scale GBS encompass large-scale ecological and hydrological interventions—such as riparian buffers, urban agriculture, urban forests, and constructed wetlands—that operate at the metropolitan or basin scale. These measures influence hydrological regimes across expansive regions, providing structural and long-term flood mitigation benefits. Staccione et al. (2024) demonstrated through city-scale pluvial flood modeling that expanding green infrastructure by 25% across the Milan metropolitan area could reduce building damages by 50%, lower population exposure by 40%, and decrease flood damages by up to 60% under extreme rainfall conditions. At even larger spatial extents, multiple studies showed that wetland-based and retention systems are highly effective in reducing basin-scale flood hazards (Gupta et al., 2024; Khalafallah et al., 2025; Peng et al., 2025). For example, Gupta et al. (2024) reported that rejuvenated wetlands across the 190,000 km² Brahmaputra River basin reduced peak streamflow by 5.1-8.3% and lowered the frequency of flood-threat events by 30-65% in major cities. Collectively, these studies demonstrate that macro-scale GBS deliver the most substantial and durable reductions in urban and regional flood risk, particularly when implemented as interconnected ecological networks spanning catchments, river corridors, and metropolitan systems.
Discussion
NbS are increasingly recognized as having strong potential to address multiple societal and environmental challenges, yet further empirical evidence is needed to guide their optimal design and application across different scales and contexts (e.g., Chausson et al., 2020; IUCN, 2020; Seddon et al., 2020; United Nations Environment Programme, 2021). In response to this need, the present review synthesizes empirical findings on NbS in urban environments, demonstrating that GBS play a critical role in addressing two of the IUCN’s major societal challenges—climate change mitigation and adaptation, and disaster risk reduction—through measurable reductions in urban heat and flooding.
A review of ten empirical heat-mitigation studies shows that cooling benefits are maximized when ecological systems are designed to be interconnected and to include optimized spatial configurations, diverse vegetation structures, and hydrological connectivity. This suggests that not only the quantitative expansion of green–blue spaces but also their qualitative characteristics are critical for enhancing cooling performance. For example, park’s internal thermal condition is the strongest determinant of the surrounding air temperature (Chang & Li, 2014), indicating that vegetation quality within a park plays a decisive role in regulating near-park microclimates. In particular, the shading capacity and evapotranspiration potential of tree canopies were identified as the primary drivers of enhanced cooling, indicating the importance of increasing tree-canopy cover while reducing the amount of bare soil in green spaces. Moreover, because cooling effects typically extend about 35-840 m from individual parks (Hamada & Ohta, 2010; Lin et al., 2015), distributing multiple medium-sized green patches throughout the urban is likely to provide broader city-wide cooling benefits than concentrating vegetation in a single location.
For flood mitigation, GBS implemented at micro-, meso-, and macro-scales each play complementary and mutually reinforcing roles. Even individual micro-scale units can measurably influence stormwater behavior during rainfall events. Because they can be deployed cost-effectively and in a highly distributed manner across dense urban areas, micro-scale NbS are particularly suitable for managing localized pluvial flooding. Their performance is further enhanced when installations are strategically positioned in low-lying or flood-prone zones, where flood volumes, inundation depths, and infrastructure vulnerabilities are greatest (Song et al., 2019). At the meso scale, NbS moderate stormwater volumes, delay hydrograph responses, and strengthen flood resilience at the district level—especially when they are hydrologically integrated with existing stormwater networks and natural flow pathways. Macro-scale GBS provide the most substantial and durable reductions in urban and regional flood risk, particularly when implemented as interconnected ecological networks spanning catchments, river corridors, and metropolitan systems. These large-scale interventions shape hydrological regimes, enhance storage capacity, and redistribute runoff across broader landscapes, thereby offering long-term flood mitigation benefits that smaller-scale interventions alone cannot achieve (Gupta et al., 2024).
Despite these insights, several limitations should be acknowledged when interpreting the findings of this review. The cited empirical studies (e.g., London, Milan, and Shenzhen) encompass diverse climatic contexts, and the effectiveness of GBS is likely to vary substantially across climate regimes. In monsoon regions such as Korea, where rainfall is highly concentrated during the summer months, the flood-mitigation efficiency of GBS may differ markedly from those observed in arid, temperate, or oceanic climates. This climatic heterogeneity was not explicitly addressed in the reviewed studies, representing a limitation. Moreover, the synthesis presented here does not fully account for the influence of urban morphological factors—such as building density, street canyon geometry, and prevailing wind pathways—which are known to mediate both the intensity and spatial reach of GBS-induced cooling and hydrological effects. Given these limitations, the application of GBS for heat and flood mitigation should be guided by empirical evidence tailored to local climatic conditions, urban structures, and hydrological settings. Future research would benefit from comparative, multi-city analyses that explicitly examine how climate, morphology, and spatial configuration interact to determine GBS performance across scales.
Conclusion
This review demonstrates that urban GBS play a critical role in addressing two of the IUCN’s major societal challenges—climate change mitigation and adaptation, and disaster risk reduction—through measurable reductions in urban heat and flooding. Across the reviewed studies, the effectiveness of GBS depends strongly on spatial scale, ecological configuration, and the biophysical characteristics of both the intervention site and the surrounding landscape. These findings highlight that the value of NbS lies not only in increasing the quantity of urban GBS but also in designing interventions that function effectively as interconnected ecological systems. To maximize climate resilience, cities must consider scale-appropriate placement, vegetation structure, connectivity, and the integration of GBS into existing urban infrastructure. Future research should build on these insights by developing standardized metrics for assessing NbS performance, monitoring long-term outcomes under climate change scenarios, and supporting evidence-based urban planning that integrates NbS as a central strategy for sustainable and resilient city development.
Author Contributions
Conceptualization: SRK. Acquisition of data: SC. Writing – original draft: SRK, SC. Writing – review & editing: SRK, SC, BRK.
Funding
This study was supported by the National Institute of Ecology, funded by the Ministry of Environment of the Republic of Korea (NIE-C-2025-128).
References
Chang, C.R., and Li, M.H. Effects of urban parks on the local urban thermal environment. Urban Forestry & Urban Greening, 13, 672-681. https://doi.org/10.1016/j.ufug.2014.08.001
Chen, A., Yao, X.A., Sun, R., and Chen, L. (2014). Effect of urban green patterns on surface urban cool islands and its seasonal variations. Urban Forestry & Urban Greening, 13, 646-654. https://doi.org/10.1016/j.ufug.2014.07.006
Convention on Biological Diversity (CBD). (2022). Nations adopt four goals, 23 targets for 2030 In landmark UN biodiversity agreement. CBD. Retrieved Nov 1, 2025 from https://www.cbd.int/article/cop15-cbd-press-release-final-19dec2022.
Du, H., Cai, W., Xu, Y., Wang, Z., Wang, Y., and Cai, Y. (2017). Quantifying the cool island effects of urban green spaces using remote sensing data. Urban Forestry & Urban Greening, 27, 24-31. https://doi.org/10.1016/j.ufug.2017.06.008
Esraz-Ul-Zannat, M., Dedekorkut‐Howes, A., and Morgan, E.A. (2024). A review of nature-based infrastructures and their effectiveness for urban flood risk mitigation. Wiley Interdisciplinary Reviews: Climate Change, 15, e889. https://doi.org/10.1002/wcc.889
Hamada, S., and Ohta, T. (2010). Seasonal variations in the cooling effect of urban green areas on surrounding urban areas. Urban Forestry & Urban Greening, 9, 15-24. https://doi.org/10.1016/j.ufug.2009.10.002
International Union for Conservation of Nature (IUCN). (2016). Resolution WCC-2016-Res-069: defining nature-based solutions. IUCN World Conservation Congress. Retrieved month day, year from https://portals.iucn.org/library/node/46486.
Monteiro, M.V., Doick, K.J., Handley, P., and Peace, A. (2016). The impact of greenspace size on the extent of local nocturnal air temperature cooling in London. Urban Forestry & Urban Greening, 16, 160-169. https://doi.org/10.1016/j.ufug.2016.02.008
Figure and Tables
Fig. 1
Screening and selection flow diagram for green and blue spaces–temperature and flood mitigation studies.
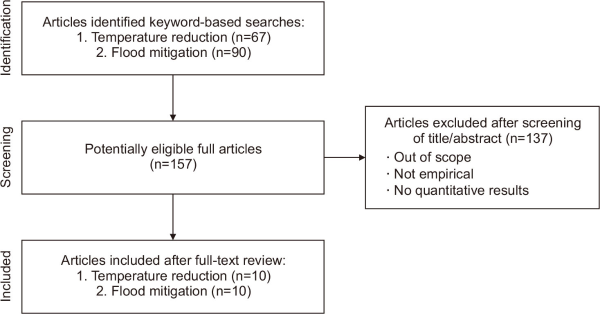
Table 1
Summary of empirical studies on GBS contributions to urban surface temperature reduction
| Societal challenges |
Authors | Country | Types of GBS | Area (ha) | Outcome measure | Effect | Findings |
|---|---|---|---|---|---|---|---|
| Climate change mitigation and adaptation (urban surface temperature reduction) | Bowler et al., 2010 | Global (meta-analysis) | 47 Urban green infrastructure (parks, trees, grass, green roofs) | 0.02-525 | ΔT | Daytime: 0.94°C cooler; nighttime: 1.15°C cooler | Across 47 eligible studies (74 identified), most observational evidence indicates green sites are cooler than nearby urban sites. The meta-analysis of park cooling effects (16 studies, 26 effect sizes) showed a consistent cooling effect during both day and night |
| Cao et al., 2010 | Japan (Nagoya) | 92 Parks | 0.1-41.9 | PCI | Spring (1.16 K), summer (1.30 K), autumn (0.43 K) | Larger parks showed stronger cooling (parks >2 ha produced PCI >~1.5 K); tree and shrub cover increased PCI, while grass land and bare soil reduced PCI | |
| Du et al., 2017 | China (Shanghai) | 68 Parks | 1-205 | TA | 3.02°C (0.78-5.2°C) | Significant negative correlation between green-space area and LST; threshold≈40 ha—cooling efficiency plateaus beyond this size; complex shapes lower LST | |
| Lin et al., 2015 | China (Beijing) | 30 Parks | 37-643 | ΔTmax | 2.3-4.8°C | Urban parks cooling extents vary widely from 35 to 840 m, increase generally with park size, show temperature reductions of about 2.3-4.8°C | |
| Yu et al., 2017 | China (Fuzhou) | 435 Green patches | 0.02-296.7 | ΔLST | Water-connected greenspaces (6.38°C); non-connected (3.61°C) | The average LST reduction was 6.38°C for water-connected patches versus 3.61°C for non-connected patches, indicating an enhanced cooling effect of approximately 2.8°C | |
| Feyisa et al., 2014 | Ethiopia (Addis Ababa) | 21 Parks | 0.85-22.3 | PCI, PCD | PCI: up to 6.72°C (mean 3.93°C); PCD: up to 224 m | Cooling effect determined by species, canopy cover, park size, and shape; temperature decreased by 0.02°C per 1% increase in canopy cover; PCI positively related to park area; Eucalyptus spp. showed the strongest cooling | |
| Chang and Li, 2014 | Taiwan (Taipei) | 60 Parks | 0.01-39.7 | LCHI,PCHI | LCHI: −3 to +3°C; PCHI: −2 to +2°C | Thermal gradients differ by park type and time; park size >5 ha → stronger external cooling; vegetation >30%, paved <50% → extended cooling | |
| Chen et al., 2014 | China (Beijing) | Urban green patches (trees, shrubs, grass, crops, river, lake) | Total 6,450 (35% of study area) | UCI | Strongest UCI: lake; moderate: trees, river (seasonally variable); weaker: shrubs and grass (especially in cold season) | Larger patch area, higher neighboring green proportion, and greater edge length are associated with stronger cooling, with effects most pronounced in summer | |
| Hamada & Ohta, 2010 | Japan (Nagoya) | Heiwa Park | 147 (60% forest, 7% grass) | ΔT | Max ΔT=1.9°C (July, 16:00); Min=−0.3°C (March noon); Cooling extent: 200-300 m at night; up to 300-500 m daytime (Aug-Oct) | Clear seasonal variation: stronger cooling in summer, weaker in winter; forest-cover ratio (within 200 m) significantly correlated with lower air temperature (−0.34°C per +10% forest cover) | |
| Monteiro et al., 2016 | United Kingdom (London) | 8 Gardens & parks | 0.2-12.1 | UHI, cooling distance | Mean cooling intensity: 0.3-1.0°C, cooling extent: ~0 m for <0.5 ha, 30-120 m for 0.8-3.8 ha, 180-330 m for 10-12 ha | Cooling extent increases linearly with greenspace area; very small (<0.5 ha): negligible external effect; small (0.8-3.8 ha): 0.4-0.8°C cooling, 30-120 m reach; medium (10-12 ha): 0.6-1.0°C cooling, up to 330 m reach |
GBS, green and blue space; ΔT, temperature difference, Turban–Tpark; PCI, park cool intensity; TA, temperature drop amplitude; ΔTmax, maximum temperature difference; LST, land surface temperature; PCD, park cooling distance; LCHI, local cool/heat island intensity; PCHI, park cool/heat island intensity; UCI, urban cooling island; UHI, urban heat island.
Table 2
Summary of empirical studies on GBS contributions to urban flood reduction
| Societal challenges |
Authors | Country | Types of GBS |
Area | Outcome measure |
Effect | Findings |
|---|---|---|---|---|---|---|---|
| Disaster risk reduction (flood reduction) | Song et al., 2019 | China (Shenzhen) | LID infrastructure (permeable pavements, green roofs, concave green fields et al.) | 37.68 km² | Model simulation (Absorption, recovery, adaptation capacity) |
Absorption time (0.00-10.40 h → 2.15-11.21 h); recovery capacity (76.38% → 98.19%); 35% of previously flooded areas no longer flooded | LID implementation significantly improved drainage infrastructure’s absorption and recovery capacities; to maximize effectiveness, LID structures should be targeted toward low-lying, flood-prone zones, where flood volume and inundation depth are highest and infrastructure is weakest |
| Richter & Dickhaut, 2023 | Germany (Hamburg) | BGR systems | Four 220 m2 roofs and two 135 m2 roofs | Long-term hydrological monitoring (2017-2023) | 64-74% of annual precipitation retained; peak runoff coefficients extremely low (Cp=0.02-0.04) | BGRs significantly reduced and delayed stormwater runoff, outperforming conventional extensive GRs; long-term storage systems provided the strongest retention and longest detention times | |
| Palermo et al. 2023 | Italy | Green walls | Two vegetation boxes per 100×100 cm panel | RC; TSO | RC range: 0-81.6% (mean: 42%); TSO range: 4-35 min (mean: 12 min) | The modular green wall system demonstrated good stormwater retention capacity | |
| Giermek, 2015 | South Africa (Cape Town; Liesbeek River) | Small urban wetland (Valkenberg Wetland) | 1.54 km2 surface area (wetland adjacent to urban river) | Peak flow hydrographs | Peak flow reduction: up to 42% during sharp, flashy events; ~20% during long-duration events | The urban wetland attenuated peak flows by accepting a portion of stormwater during high-intensity rainfall. Attenuation was most effective for short, sudden flood peaks; highlights the potential of small urban wetlands as part of sustainable urban drainage, though insufficient alone to prevent major floods | |
| Laub et al., 2024 | USA (San Antonio, Texas) | 2 Bioretention basins | Drainage areas 5.5 ha & 0.4 ha | Hydrograph analysis (peak flow, rise/fall rates, duration) | Peak flow reduced by >80% on average; flashiness (rate of rise/fall) reduced by 80-90% | Bioretention basins substantially reduced peak flow; basins increased runoff duration and delayed hydrograph response, reducing downstream flood risk | |
| Jeon et al., 2021 | South Korea (Cheonan) | Rain garden | Catchment area (476 m²) | 5-year field monitoring (23 rainfall events) | Runoff reduction: initially 98% to 88% after 5 years | The rain garden still achieved an 88% runoff reduction after five years, indicating sustained high hydrological performance | |
| Staccione et al., 2024 | Italy (Metropolitan City of Milan) | GI (urban parks, green roofs, green spaces, green corridors et al.) | Milan metropolitan area | Pluvial flood hazard modelling | Damage reduction up to ~60%; population exposed reduced 40% with only +25% GI | Expanding the GI network by 25% cuts building damages by 50% and reduces population exposure by 40%. Combined GI expansion (green city) is more effective than using green roofs or ground GI alone | |
| Peng et al., 2025 | UK (London Borough of Enfield) | 7 Constructed wetlands | Catchment area (41 km², 37 km²) | River flow analysis | High flows decreased by 18-23%, while low flows increased by 35-50% | Constructed wetlands lowered peak flows during storm events and increased baseflows during dry periods, contributing to a more stable urban water regime | |
| Gupta et al., 2024 | India (Brahmaputra River catchment) | Rejuvenated wetlands | 190,000 km² (catchment scale) | Streamflow reduction (%), water level reduction (m), flood-threat level occurrence | Peak streamflow reduced by 5.1-8.3%; flood-threat events reduced by up to 30-65% (at major cities) | Rejuvenated & actively managed wetlands significantly attenuate flood peaks across the basin especially when connected to nearby streams and operated with controlled releases | |
| Khalafallah et al., 2025 | Serbia (Tamnava Basin) | Retention ponds | 730 km² (basin scale) | Flood area reduction (%), flood volume reduction (%), flood damage reduction (%) | Flood area reduced by 20-27%, flood volume reduced by 28-35%, flood damage reduced by 40-45% | Retention ponds significantly reduced basin-scale flood hazards under current & future climates; larger or multiple ponds (in series) performed best |