Introduction
Kunming–Montreal Global Biodiversity Framework (GBF) Target 3 calls for conserving at least 30% of terrestrial, inland water, and marine areas by 2030 through effectively and adequately connected protected areas and other effective area-based conservation measures (Convention on Biological Diversity [CBD], 2022). Compared with the former Aichi Target 11, GBF Target 3 places greater emphasis not only on the extent of protected areas but also on their quality and connectivity, increasing the demand for indicators capable of quantitatively assessing protected area connectivity.
In response to this demand, Protected Connected land indicator (ProtConn) has emerged as the most widely applied global indicator for evaluating the structural connectivity of protected area networks (Saura et al., 2018). ProtConn is grounded in landscape ecology and metapopulation theory and represents the structural characteristics of protected area networks. Its four components—Within, Contig, Unprot, and Trans—capture internal connectivity within protected areas, physical connectivity among adjacent protected areas, functional connectivity across non-adjacent protected areas through the surrounding matrix, and transboundary connectivity, respectively (Saura et al., 2017). These components are theoretically linked to key ecological mechanisms that support biodiversity persistence, including species movement, population rescue effects, and the maintenance of gene flow (Hanski, 1998).
Within the GBF Target 3 monitoring framework, ProtConn is defined as a structural condition indicator, whereas the Species Protection Index (SPI) is defined as an outcome indicator reflecting conservation success in terms of species range coverage (United Nations Environment Programme World Conservation Monitoring Center [UNEP-WCMC] & International Union for Conservation of Nature [IUCN], 2024). Although these indicators are reported in parallel to represent the “condition–outcome” logic of conservation policy, no empirical studies have examined their statistical relationship at national scales. The Protected Planet Report 2024 likewise presents ProtConn and SPI side by side but does not specify how structural connectivity relates to observed biodiversity outcomes (UNEP-WCMC & IUCN, 2024).
Existing research has primarily focused on estimating ProtConn values and describing their spatial or temporal variation. Saura et al. (2017; 2018; 2019) presented global assessments and time-series analyses of ProtConn but did not investigate whether increases in ProtConn are associated with improved species distributions, increased species richness, or reduced extinction risk. While some studies suggest that connectivity may indirectly influence ecosystem stability or habitat quality (Castillo et al., 2020; Zhao et al., 2022), direct species-based empirical analyses remain scarce.
Despite the availability of nationally standardized, high-resolution biodiversity datasets in Korea, empirical studies linking ProtConn with biodiversity indicators have not yet been conducted domestically or internationally. This study addresses this gap by clarifying the conceptual scope and limitations of ProtConn within the GBF Target 3 framework and by assessing whether existing national biodiversity datasets in Korea provide a feasible foundation for future empirical ProtConn–SPI or ProtConn–biodiversity linkage analyses.
Materials and Methods
This study adopts a theoretical and methodological review approach to examine the conceptual relationship between ProtConn and biodiversity indicators. First, internationally validated literature and official policy reports were systematically reviewed to clarify the definition of ProtConn, the ecological significance of its components, and the characteristics of country-level estimates, with a particular focus on Saura et al. (2017; 2018; 2019). To establish the theoretical foundations of ProtConn as a structural connectivity indicator, key ecological theories related to connectivity—including metapopulation theory (Hanski, 1998), island biogeography, and dispersal and gene flow theory—were reviewed. In addition, policy-oriented documents, including the Protected Planet Report 2024 (UNEP-WCMC & IUCN, 2024), were analyzed to examine the respective roles of ProtConn and the SPI as component indicators under the GBF Target 3 monitoring framework, and to identify current international limitations in empirical linkage analyses between these indicators.
Furthermore, rather than conducting empirical comparisons, this study performed a data feasibility assessment to evaluate the potential for future ProtConn–SPI or ProtConn–species indicator analyses in Korea. This assessment examined the spatial resolution, temporal coverage, taxonomic scope, and spatial unit compatibility of datasets from the National Ecosystem Survey (National Institute of Ecology; NIE), species occurrence records from the National Institute of Biological Resources (NIBR), and species inventory and ecological survey data produced by the Korea National Park Service (KNPS). The analysis focused on whether these datasets can be spatially aligned with ProtConn values at common grid units, thereby enabling future quantitative analyses of relationships between protected area connectivity and biodiversity indicators.
Results
ProtConn is widely applied as a global indicator for quantifying the structural connectivity of protected area networks (Saura et al., 2017; 2018). It consists of four components—Within, Contig, Unprot, and Trans—each capturing a distinct aspect of network structure, including internal connectivity within protected areas, connectivity among adjacent protected areas, functional connectivity across non-adjacent protected areas through the surrounding matrix, and transboundary connectivity (Table 1). These components describe the spatial configuration and potential coherence of protected area systems but do not directly measure biodiversity outcomes.
International assessments report substantial variation in ProtConn values among countries. According to CBD synthesis reports (CBD, 2021a; 2021b; 2021c), Germany exhibits relatively high ProtConn values (35.1%), while the Republic of Korea shows lower connectivity (approximately 9.0%), and Japan displays intermediate values (14.8%). These differences reflect variation in national topography, land-use patterns, and the spatial configuration of protected area systems.
To assess the feasibility of empirical linkage analyses between ProtConn and biodiversity indicators, this study examined three nationally standardized biodiversity data sources in Korea: the National Ecosystem Survey conducted by the NIE (2024), national biodiversity statistics compiled by the NIBR (2025), and species inventory data produced by the KNPS (2023).
The National Ecosystem Survey provides nationwide, grid-based biodiversity data derived from systematic field surveys, covering major taxonomic groups including plants, mammals, birds, amphibians, reptiles, fish, and invertebrates. Its spatial structure allows direct alignment with ProtConn values calculated at comparable spatial units, enabling potential overlay analyses of species richness and taxon-specific occurrence patterns. National biodiversity statistics published by NIBR synthesize verified species occurrence records and official inventories, documenting 61,230 species in Korea as of 2024. These statistics provide standardized indicators on total species richness, threatened species occurrence, and taxonomic composition at national and subnational scales. Species inventory data compiled by KNPS integrate systematic natural resource surveys across 23 national parks and document 23,777 species across diverse taxonomic groups. Although these data do not represent continuous population-level time series, they provide spatially explicit species richness information at the protected area scale.
Together, these datasets demonstrate that nationally standardized biodiversity data in Korea are spatially and taxonomically compatible with ProtConn-based analyses. While this study does not perform statistical linkage analyses, the results demonstrate that Korea possesses a sufficiently robust and structured biodiversity data infrastructure to support future quantitative evaluations of the relationship between ProtConn and biodiversity indicators.
Discussion
ProtConn is an internationally recognized connectivity indicator for protected area networks and is theoretically expected to contribute to biodiversity conservation. Ecological theories, including metapopulation dynamics and gene flow, consistently demonstrate that connectivity plays a critical role in sustaining species persistence (Hanski, 1998). However, despite this strong theoretical foundation, empirical evidence demonstrating that higher ProtConn values lead to measurable improvements in biodiversity indicators remains limited. Accordingly, ProtConn should be interpreted primarily as a structural indicator that characterizes enabling conditions for conservation rather than as a direct measure of conservation performance.
This structural role is reflected in the way ProtConn characterizes protected area networks through multiple dimensions of connectivity. Rather than representing biological responses directly, ProtConn components describe how protected areas are spatially configured and potentially connected within landscapes. As summarized in Table 1, national-scale applications commonly show that internal connectivity within protected areas contributes most strongly to overall ProtConn values, whereas connectivity mediated through non-adjacent or transboundary protected areas generally accounts for a smaller proportion (Saura et al., 2017; Hilty et al., 2020; UNEP-WCMC & IUCN, 2024). These contribution ranges represent general structural tendencies observed across countries and should not be interpreted as causal effects on biodiversity outcomes.
Each ProtConn component is also associated with inherent limitations. Internal connectivity does not capture interactions among separate protected areas, adjacency-based connectivity is restricted to directly neighboring sites, connectivity through unprotected matrices relies on assumptions regarding species dispersal ability, and transboundary connectivity is constrained by data availability and international coordination. These limitations highlight that ProtConn alone cannot explain species-level conservation outcomes, underscoring the need for a conceptual framework that explicitly links structural connectivity to ecological mechanisms and biodiversity indicators.
Building on this need, Fig. 1 presents a conceptual framework proposed in this study that integrates protected area network structure, ecological theory, and biodiversity outcome indicators. By characterizing protected area configuration through ProtConn and linking it to established ecological mechanisms—such as species dispersal, gene flow, and metapopulation stability—the framework illustrates how structural connectivity may create conditions under which species-level conservation outcomes can be evaluated using outcome indicators such as the SPI. Importantly, this framework is conceptual in nature and is intended to clarify logical linkages rather than to depict empirically validated causal relationships.
The theoretical basis for these linkages is further synthesized in Table 2, which situates the proposed ProtConn–SPI framework within established ecological theory. While major theoretical perspectives—including metapopulation dynamics, island biogeography, and landscape ecology—strongly support the importance of connectivity for population persistence and species distributions, Table 2 also highlights important conceptual gaps. In particular, several connectivity-related processes, such as gene flow and source–sink dynamics, are not directly captured by outcome indicators focused on species range coverage. This reinforces the interpretation that ProtConn and SPI represent complementary, rather than interchangeable, dimensions of conservation assessment.
In this context, SPI provides a complementary outcome indicator that directly measures the extent to which species’ geographic ranges are covered by protected areas. When considered alongside ProtConn, SPI enables examination of structure–outcome relationships in conservation planning, consistent with the GBF Target 3 monitoring framework (UNEP-WCMC & IUCN, 2024). Nevertheless, empirical analyses directly linking ProtConn and SPI remain scarce, highlighting a critical research gap.
Korea is particularly well positioned to address this gap, given the availability of nationally standardized biodiversity datasets, including the National Ecosystem Survey conducted by the NIE, biodiversity statistics compiled by the NIBR, and species inventory data produced by the KNPS Together, these datasets provide a robust foundation for future empirical analyses examining whether areas characterized by higher structural connectivity also exhibit higher species richness or greater representation of threatened species.
In conclusion, ProtConn serves as a robust indicator for characterizing the structural foundation of protected area networks and plays a central role in monitoring progress toward GBF Target 3. However, its contribution to biodiversity conservation outcomes cannot be fully assessed without empirical validation against outcome-based indicators. By integrating ProtConn, ecological theory, and outcome indicators within a coherent conceptual framework, this study clarifies the interpretive scope of connectivity indicators and outlines a structured pathway for future evidence-based conservation research.
Author Contributions
Conceptualization: SRK. Funding acquisition: YC, SRK.Investigation: SRK. Methodology: YC, SRK. Validation: YC, SRK. Writing – original draft: SRK. Writing – review & editing: YC.
Funding
This work was supported by a grant from the National Institute of Ecology (NIE) funded by the Ministry of Environment (MOE) of the Republic of Korea (NIE-C-2025-128).
References
, , , , , (2018) Protected area connectivity: shortfalls in global targets and country-level priorities https://doi.org/10.1016/j.bioconArticle Id (pmcid)
Figure and Tables
Fig. 1
Conceptual framework illustrating the theoretical relationship between Protected Connected land indicator (ProtConn) and Species Protection Index (SPI) in biodiversity conservation assessment. ProtConn acts as a process indicator measuring the structural connectivity of protected area networks through four components (Within, Contig, Unprot, Trans). SPI functions as an outcome indicator directly assessing species-level conservation performance. Pathways linking these indicators through ecological mechanisms (species dispersal, gene flow, metapopulation stability) are grounded in theoretical frameworks from landscape ecology and metapopulation theory. However, direct empirical evidence that ProtConn increases lead to measurable biodiversity improvements remains limited. Dotted lines indicate relationships requiring further empirical validation. Both indicators are recognized as component metrics for monitoring progress toward Global Biodiversity Framework (GBF) Target 3. This framework highlights key research gaps, particularly the need for quantitative studies integrating spatial connectivity data with biodiversity monitoring datasets at the national scale where comprehensive ecological survey data are available (e.g., Korea’s National Institute of Ecology National Natural Environment Survey, National Institute of Biological Resources species occurrence records, and Korea National Park Service long-term monitoring data).
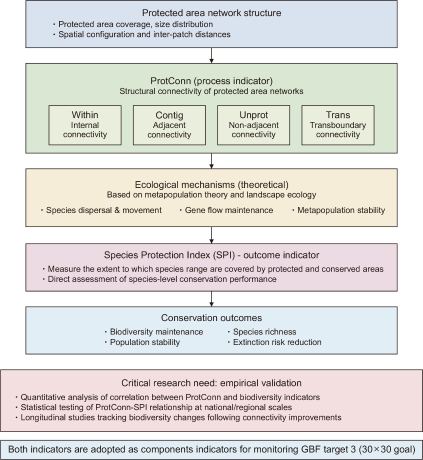
Table 1
Ecological significance of ProtConn components
| ProtConn component |
Definition | General contribution (%) | Most relevant target | Key limitations |
|---|---|---|---|---|
| Within | Connectivity within individual protected areas | 40-60 | Large protected areas; wide-ranging species | Does not reflect connectivity between areas |
| Contig | Connectivity through physically adjacent protected areas | 20-35 | All species; particularly important for species with low mobility | Limited to directly adjacent areas |
| Unprot | Connectivity through non-adjacent protected areas within dispersal distance | 15-30 | Species with medium-high dispersal ability | Species-specific diffusion parameters required |
| Trans | Transboundary connectivity | 5-15 | Migratory species; species whose range crosses borders | Data availability issues; international cooperation required |
Table 2
ProtConn–SPI connectivity assessment based on ecological theory
| Theoretical framework | Key predictions | Empirical support level | ProtConn-SPI relevance |
|---|---|---|---|
| Metapopulation theory | Connected habitat patches support more viable populations through settlement-extinction dynamics and structural effects | Strong - Extensive evidence across multiple taxa and systems | High - Predict that connectivity should enhance species persistence and range occupancy |
| Island biogeography theory | Connected protected areas support higher species richness through enhanced colonization and reduced extinction | Strong - Well supported in actual islands and habitat fragments | Moderate - Primarily predicts species richness rather than range extent |
| Source-sink dynamics | Connectivity allows source populations to shape the demographic structure of sink populations | Moderate - Documented in multiple systems but difficult to measure | Moderate - Related to population maintenance but indirectly linked to range extent |
| Gene flow theory | Connectivity maintains genetic diversity and adaptive potential through gene flow | Strong - Genetic studies consistently show connectivity effects | Low - Genetic diversity is not directly measured by SPI |
| Principles of landscape ecology | Landscape composition influences ecological processes at multiple spatial scales | Strong - Extensive theoretical and empirical foundation | High - ProtConn explicitly applies landscape ecology principles |