Introduction
An alien species is defined under the Act on the Conservation and Use of Biological Diversity (abbreviated as the Biological Diversity Act) as an organism that has been introduced intentionally or naturally from abroad and exists outside its original range or habitat (Ministry of Government Legislation, Republic of Korea, 2024). Among them, alien species that are considered to pose high potential risk or are already evaluated as highly hazardous and require management are designated and publicly notified under the same Act as Alert Alien Species, Ecosystem Disturbing Concern Species, and Ecosystem Disturbing Species. Ecosystem disturbing species are defined as organisms that disrupt or are likely to disrupt the balance of the ecosystem. As of October 2024, a total of 40 taxa, including one genus of the Trachemys turtles, 21 other animal species, and 18 plant species, have been designated and publicly announced (Ministry of Government Legislation, Republic of Korea, 2024).
Internationally, alien species that have become established and exert negative impacts on biodiversity and ecosystems are defined as invasive alien species (IAS). The Intergovernmental Science-Policy Platform on Biodiversity and Ecosystem Services (Roy et al., 2023) reports that IAS are one of the major drivers of global biodiversity loss. Consequently, countries around the world are making continuous efforts to manage and prevent their spread.
Sicyos angulatus L. (burcucumber) is an annual climbing herb of the family Cucurbitaceae, native to North America, and it primarily occurs along riverbanks and adjacent riparian areas (Kurokawa, 2009; Kurokawa et al., 2009; Larché, 2004). Under non-competitive conditions, a single S. angulatus plant can produce approximately 4,500 to 78,000 seeds (Esbenshade et al., 2001; Kurokawa, 2009; Smeda & Weller, 2001a), and germination can occur continuously throughout the growing season (Messersmith et al., 1999). In Korea, germination mainly occurs from April to May but can continue successively until mid-September (Kang, 2014). It is presumed that S. angulatus was introduced into Korea during the late 1970s or 1980s, mixed with imported grains from North America. Furthermore, its spread is thought to have been facilitated in the late 1980s when it was used as a rootstock for cucurbit crops such as watermelon and cucumber (Kang, 2014; National Institute of Ecology [NIE], 2021). Owing to the high ecological risk it poses to natural ecosystems following its introduction into Korea, S. angulatus was designated and has been managed as an Ecosystem Disturbing Species since 2009.
In some invaded regions abroad, S. angulatus has caused economic damage, such as reducing crop yields in maize (Zea mays) fields (Dowler, 1994; Shimizu, 1999). In Japan in particular, it has spread into natural ecosystems, where it suppresses the growth of native plants and causes ecological damage (Watanabe et al., 2002). Due to these impacts, S. angulatus has been included among the legally and institutionally regulated IAS in several countries. For example, in Japan, it is designated as a “Specified Invasive Alien Species” under the Invasive Alien Species Act, which prohibits its import, transport, possession, and cultivation (Ministry of the Environment, Japan, 2004). In the Catalonia region of Spain, S. angulatus is designated as a “quarantine pest,” and compulsory control measures are implemented to prevent its spread (Government of Catalonia, 2005). In parts of Italy, S. angulatus has been listed on the regional blacklist of IAS, with monitoring and control measures enforced to limit its spread (Regione Lombardia, 2019). Even in its native range, the United States, S. angulatus has been designated as a noxious weed in several states, including Delaware, as a measure to prevent agricultural losses (Delaware Department of Agriculture, 1986).
Thus, S. angulatus is recognized both in Korea and abroad as a representative invasive alien plant species that requires intensive management, and ecological studies tailored to different habitat types are essential for developing effective management strategies. In particular, riparian zones, the primary habitats of S. angulatus, exhibit high environmental variability and pronounced vegetation dynamics, highlighting the importance of understanding the species’ distribution patterns in these areas. Accordingly, ecological studies focusing on S. angulatus in riparian areas have also been conducted in Korea. For example, previous studies have examined various ecological aspects of S. angulatus, including the effects of environmental factors such as flow velocity and soil texture on its population density in rivers (Lee et al., 2020), the impact of its invasion on riparian vegetation in Korea (Lee et al., 2015), and changes in weed species composition within S. angulatus communities (Moon et al., 2008). However, these previous studies have been limited to short-term surveys lasting 1 or 2 years, and research on long-term community structural dynamics remains scarce. Therefore, this study aims to analyze the structural and distributional changes of S. angulatus communities along riparian zones over a 5-year period, to elucidate its ecological impacts and distribution patterns, and to provide baseline information for establishing effective management strategies.
Materials and Methods
Study area
The study sites were selected as part of the “Monitoring of Invasive Alien Species” project conducted by the NIE. To investigate the distribution patterns of S. angulatus in riparian areas, four sites characterized by riparian habitats were selected for analysis. The four study sites included one location in the Han River basin (Sa1) and three locations in the Nakdong River basin (Sa2-Sa4) (Fig. 1, Table 1).
The monthly average temperature (°C) and monthly precipitation (mm) recorded from 2019 to 2024 at the nearest automatic weather observation stations to each study site are shown in Fig. 2 (Korea Meteorological Administration, 2025).
Survey and analysis method
The four selected study sites were designated as fixed monitoring plots, and field surveys were conducted annually over a period of approximately 5 years, from 2020 to 2024. Field surveys were conducted between July and September, the period when S. angulatus reaches its peak growth.
To understand the competitive interactions and spread patterns of S. angulatus within the surrounding vegetation at each site, a current vegetation map was prepared. The same survey area was maintained as much as possible at each fixed site. However, due to the characteristics of the river environment and anthropogenic disturbances (e.g., river construction), the surveyed area varied slightly between years. To accurately assess the relative dominance of S. angulatus communities, the ratio of the S. angulatus community area to the total surveyed area was calculated and analyzed.
In addition, vegetation surveys were conducted in parallel to examine the distribution characteristics of S. angulatus. The vegetation survey was conducted using the quadrat method, recording the coverage of species occurring in each vegetation layer. At each study site, ten 1×1 m quadrats were randomly established within the entire area of the S. angulatus community for sampling. The coverage of each species was recorded using a nine-grade scale based on the modified Braun-Blanquet cover-abundance scale (Westhoff & van der Maarel, 1978). Based on the collected data, the importance value (IV) for each species was calculated as the mean of its relative coverage and relative frequency, in order to compare the relative dominance of the target species within the community. Using the IV, the Shannon-Wiener diversity index (Shannon, 1948) was calculated to evaluate annual changes in community diversity.
Statistical analysis
Annual variations in the Shannon-Wiener diversity index (H′) and IV of S. angulatus communities were tested for each study site from 2020 to 2024. Since the data were repeatedly measured at the same sites, a non-parametric repeated-measures test (Friedman test; Friedman, 1937) was conducted. When significant differences were found, pairwise Wilcoxon signed-rank tests were performed as post hoc analyses to identify specific differences between years (Wilcoxon, 1945). To correct for Type I errors arising from multiple comparisons, the Holm method was applied (Holm, 1979).
To examine changes in vegetation community structure, a non-metric multidimensional scaling (NMDS) analysis was performed (Kruskal, 1964). The NMDS was based on Bray–Curtis dissimilarity (Bray & Curtis, 1957) and reduced to two dimensions, and the analysis was conducted using the metaMDS function of the vegan package (Oksanen et al., 2025). The stress value was presented as an indicator to assess the goodness of fit of the community structure. To examine differences among communities, permutational analysis of variance (PERMANOVA) was performed using the adonis2 function with 999 permutations (Anderson, 2001), and the homogeneity of multivariate dispersion among groups was tested using the betadisper function (Anderson et al., 2006; Warton et al., 2012).
All statistical analyses were performed using R version 4.4.1 (The R Foundation, Vienna, Austria; R Core Team, 2024), with a significance level set at P<0.05.
Results and Discussion
Temporal and spatial variation in Sicyos angulatus communities
Over the 5-year period, the proportion of the S. angulatus distribution area relative to the total vegetation area at each site exhibited a dynamic pattern, characterized by repeated increases and decreases (Table 2). In particular, site Sa1 showed the greatest fluctuation, with the distribution area sharply decreasing to 11.5% in 2021 and then increasing to 65.3% in 2023. Similarly, site Sa2 exhibited a sharp rebound, increasing from 5.3% in 2021 to 49.3% in 2022, indicating a high degree of community recovery resilience. At site Sa3, the distribution area decreased to 29.6% in 2021 and then increased again to 40.8% in 2022, showing a moderate level of fluctuation. In contrast, site Sa4 maintained a relatively stable proportion of approximately 15-20% throughout the 5-year period. These dynamic changes in S. angulatus communities are associated with the periodic disturbances in river ecosystems, and are likely to be strongly influenced by summer rainfall patterns. S. angulatus prefers humid, nutrient-rich riverine environments and possesses traits that favor seed dispersal by flooding and rapid recolonization of open niches created by the removal of competing vegetation (Uchida et al., 2012). Therefore, heavy rainfall events are considered decisive environmental factors that optimize the growth conditions of S. angulatus, enhance its early dominance, and consequently expand its community coverage.
The species diversity within S. angulatus communities showed a decreasing trend over time, whereas the IV of S. angulatus exhibited a continuous increase (Fig. 3). When the annual average changes were analyzed by combining all study sites, statistically significant differences were observed overall (Friedman test, P<0.05) (Fig. 4). The species diversity index within the communities declined from 3.1 in 2020 to a minimum of 2.0 in 2023, indicating a progressive simplification of the community structure. In contrast, the IV of S. angulatus increased sharply from 5.6% in 2020 to 32.9% in 2023, confirming its intensified dominance. These results are consistent with previous studies reporting that the intensity of invasion negatively affects the species diversity of native vegetation (Valone & Weyers, 2019). As the dominance intensity of invasive species increases, the reduction in native plant diversity within the community becomes more pronounced (Valone & Weyers, 2019). In particular, S. angulatus effectively excludes competing plants by maximizing light interception and spatial occupation through its dense climbing growth form (Önen et al., 2015; Smeda & Weller, 2001b). However, the post hoc pairwise Wilcoxon test did not reveal any significant differences between specific year pairs. This is likely because the number of study sites was limited and the magnitude of annual variation was relatively small, making it difficult to achieve statistical significance in pairwise comparisons.
The NMDS analysis conducted to examine changes in the plant community structure within S. angulatus stands yielded a stress value of 0.212, indicating an acceptable level for interpreting the community structure. The community ordination showed partial separation both by year and by site (Fig. 5). In the annual analysis, the 2020 community was relatively distinct from those of other years, while the 2023 community also exhibited greater variability, indicating pronounced structural changes in specific years. Sites Sa1 and Sa4 showed relatively higher temporal variability in their distribution patterns compared to other sites, and particularly, Sa4 tended to form communities spatially separated from the others. These annual separations and increased variability in community structure are closely associated with the previously observed decline in species diversity and the intensified dominance of S. angulatus (Figs. 3, 4). In other words, the continuous spread and dominance of S. angulatus are interpreted to have simplified riparian plant communities over time and driven progressive homogenization of vegetation structure across sites (Valone & Weyers, 2019). The phenomenon whereby increased dominance of invasive species reduces spatial community diversity has been documented in several studies, and in frequently disturbed riparian environments, invasive species tend to rapidly reestablish after disturbance, thereby accelerating temporal and spatial homogenization of vegetation (Anderson et al., 2006; Warton et al., 2012). The relatively high interannual variability observed at Sa1 and Sa4 suggests that these sites experienced greater environmental disturbance or heterogeneity in the invasion process compared to the other sites. Therefore, the community separation patterns and high variability identified in the NMDS results are interpreted as reflecting transitional stages in which hydrological disturbances and the spread of invasive species jointly alter vegetation stability and species composition at each site.
PERMANOVA results revealed that both year (R2=0.048, P=0.001) and site (R2=0.075, P=0.001) had significant effects on the structure of plant communities. However, the test for homogeneity of multivariate dispersion indicated slight violations of the homogeneity assumption for both year and site groups (P<0.05). Thus, the significant PERMANOVA results likely reflect not only differences in species composition among groups but also the combined influence of community variability observed in the NMDS analysis.
Suggestions for management strategies
Based on the findings of this study, S. angulatus progressively reduced species diversity within its communities over the 5-year observation period, while its IV increased sharply, indicating a progressive intensification of dominance within the community (Figs. 3, 4). These changes contributed to the simplification and spatial homogenization of vegetation structure over time, consistent with previous findings that higher invasion intensity leads to a pronounced decline in native plant diversity (Smeda & Weller, 2001a; Valone & Weyers, 2019). Furthermore, the year-specific community separation and high variability observed at sites Sa1 and Sa4 in the NMDS analysis suggest transitional stages of reduced vegetation stability, driven by the combined effects of disturbance intensity and invasive species expansion (Anderson et al., 2006; Warton et al., 2012). Taken together, the expansion of S. angulatus represents not merely an increase in alien species abundance, but an ecological threat capable of reducing the structural resilience of riparian plant communities. In particular, riparian ecosystems are highly vulnerable to disturbance and exhibit high reinvasion rates after removal (Richardson et al., 2007). Therefore, instead of relying solely on physical removal, an integrated management approach combining removal, restoration, and long-term monitoring is essential for sustainable control.
In this context, management efforts should be strategically designed to reflect the temporal and spatial dynamics revealed in this study. Rapid removal immediately after major rainfall or flooding events is critical, as these disturbances promote seed dispersal and rapid recolonization. Because germination in Korea mainly occurs from April to May and can continue until mid-September (Kang, 2014; Kurokawa, 2009; Messersmith et al., 1999; Smeda & Weller, 2001a), two to three follow-up removals throughout the growing season are recommended to prevent seed set and minimize seed-bank replenishment. Priority should be given to sites that exhibited high interannual variability or rebound patterns, such as Sa1 and Sa2, whereas relatively stable sites such as Sa4 can be monitored at a baseline level. To prevent reinvasion after removal, active revegetation with native riparian species possessing dense growth and strong rooting ability is essential to occupy open niches and stabilize the soil (NIE, 2021; Richardson et al., 2007). In addition, management should aim for “zero seed set” by removing vines before flowering and fruiting, considering that each plant can produce thousands of seeds (Esbenshade et al., 2001; Kurokawa, 2009; Smeda & Weller, 2001a). Regular monitoring of IV and H′ during the growing season (July-September) will help detect early reinvasion, and action thresholds (e.g., IV ≥30% or area coverage ≥30-40%) may be adopted to trigger intensified control (Valone & Weyers, 2019). Furthermore, coordinated management between upstream and downstream reaches should be implemented to suppress propagule flow, particularly after floods, since seed and plant fragments can easily disperse along water currents (Richardson et al., 2007; Uchida et al., 2012).
Author Contributions
Conceptualization: SIL. Data curation: HY, DC. Formal analysis: HY. Funding acquisition: SIL. Investigation: DC. Methodology: SIL. Resources: DC. Supervision: SIL. Visualization: HY. Writing – original draft: SIL. Writing – review & editing: SIL, HY, DC.
Funding
This work was supported by a grant from the National Institute of Ecology (NIE) funded by the Ministry of Environment (MOE) of the Republic of Korea (NIE-A-2025-09).
References
Delaware Department of Agriculture. (1986). Bur cucumber (Sicyos angulatus) designated as a noxious weed under title 3, chapter 24 of the Delaware Code. Delaware Department of Agriculture. Retrieved Sep 1, 2025 from https://agriculture.delaware.gov/plant-industries/noxious-weeds/.
Government of Catalonia. (2005). Orden ARP/10/2005, de 18 de enero, by which the existence of Sicyos angulatus L. is officially declared and compulsory control measures are established. Diari Oficial de la Generalitat de Catalunya. Retrieved Sep 1, 2025 from https://dogc.gencat.cat/.
Korea Meteorological Administration (KMA). (2025). Open MET data portal. KMA. Retrieved Sep 30, 2025 from https://data.kma.go.kr/.
Ministry of Government Legislation, Republic of Korea. (2024). Act on the Conservation and Use of Biological Diversity. National Law Information Center. Retrieved Sep 1, 2025 from https://www.law.go.kr/법령/생물다양성보전및이용에관한법률시행령/(34192,20240206).
Ministry of the Environment, Japan. (2004). Invasive Alien Species Act (Act No. 78 of 2004). Ministry of the Environment, Japan. Retrieved Sep 1, 2025 from https://www.env.go.jp/en/nature/as.html.
Oksanen, J., Simpson, G.L., Blanchet, F.G., Kindt, R., Legendre, P., Minchin, P.R., et al. (2025). vegan: community ecology package (R package version 2.6-10). R Foundation for Statistical Computing. Retrieved from Oct 29, 2025 from https://CRAN.R-project.org/package=vegan.
R Core Team. (2024). R: a language and environment for statistical computing. R Foundation for Statistical Computing. Retrieved Sep 26, 2025 from https://www.R-project.org/.
Regione Lombardia. (2019). D.G.R. XI/2658 - update of the blacklist of invasive alien species (animals and plants) and provisions for monitoring, control, and eradication. Regione Lombardia. Retrieved Sep 1, 2025 from https://www.biodiversita.lombardia.it/images/GENERALE/Dgr_2658_2019_LISTENERE_Lombardia.pdf.
Roy, H.E., Pauchard, A., Stoett, P., Renard Truong, T., Bacher, S., Galil, B.S., et al.; IPBES. (2023). Summary for policymakers of the thematic assessment report on invasive alien species and their control of the intergovernmental science-policy platform on biodiversity and ecosystem services. IPBES secretariat.
Figures and Tables
Fig. 1
Location of riparian monitoring sites for Sicyos angulatus communities surveyed from 2020 to 2024 in the Republic of Korea.
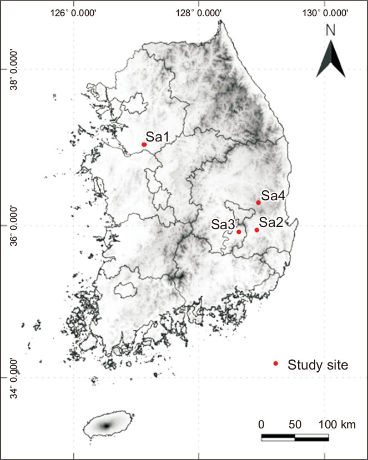
Fig. 2
Monthly average temperature (°C) and monthly precipitation (mm) at the study site. (A) Sa1, (B) Sa2, (C) Sa3, and (D) Sa4.
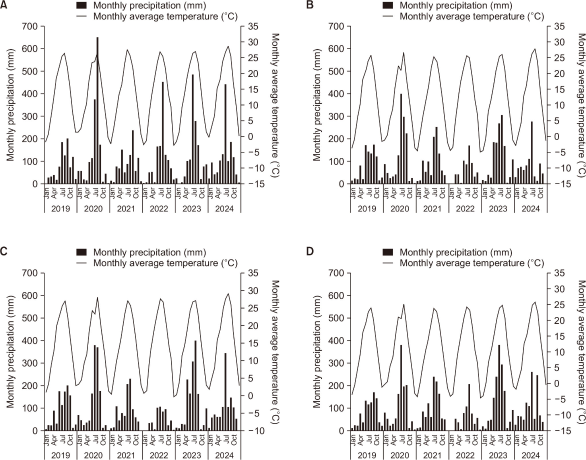
Fig. 3
Annual changes in SDI (H′, bar graph) and Sicyos angulatus IV (line graph) at each site: (A) Sa1, (B) Sa2, (C) Sa3, and (D) Sa4. SDI, Shannon-Wiener diversity index; IV, importance value.
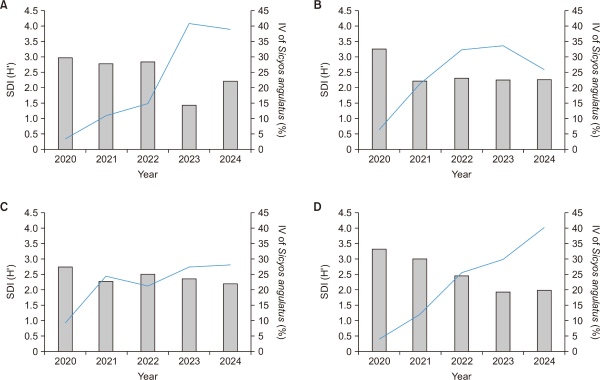
Fig. 4
Annual mean changes of (A) SDI (H′) and (B) Sicyos angulatus IV across the study sites (P<0.05). SDI, Shannon-Wiener diversity index; IV, importance value.
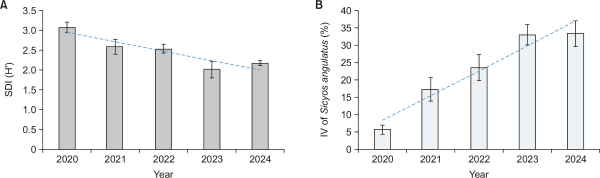
Fig. 5
NMDS ordination of plant communities by site (A) and year (B) (stress=0.212). PERMANOVA indicated significant differences in community composition among years (R2=0.048, P=0.001) and sites (R2=0.075, P=0.001). NMDS, non-metric multidimensional scaling.
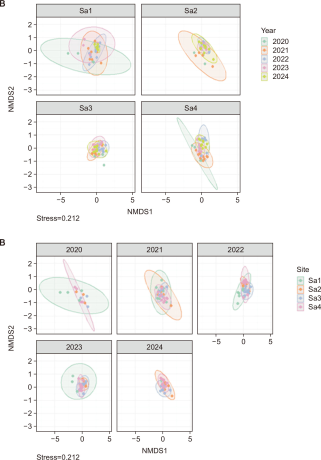
Table 1
Survey sites for Sicyos angulatus community monitoring
| Site No. | Survey period | Location | Latitude | Longitude |
|---|---|---|---|---|
| Sa1 | 2020-2024 | Oegacheon-ri, Wongok-myeon, Anseong-si, Gyeonggi-do | 37.039121 | 127.126301 |
| Sa2 | 2020-2024 | Bongjuk-ri, Geumho-eup, Yeongcheon-si, Gyeongsangbuk-do | 35.942718 | 128.922378 |
| Sa3 | 2020-2024 | Bongmu-dong, Dong-gu, Daegu | 35.918249 | 128.632916 |
| Sa4 | 2020-2024 | Gameun-ri, Andeok-myeon, Cheongsong-gun, Gyeongsangbuk-do | 36.2906791 | 128.9480369 |
Table 2
Annual change in the distribution area (%) of Sicyos angulatus from 2020 to 2024
| Site no. | Year | Total vegetation area (m2) | Sicyos angulatus area (m2) | Area percentage (%) |
|---|---|---|---|---|
| Sa1 | 2020 | 30,366 | 18,955 | 62.5 |
| 2021 | 23,295 | 2,682 | 11.5 | |
| 2022 | 26,982 | 1,915 | 7.1 | |
| 2023 | 8,674 | 5,668 | 65.3 | |
| 2024 | 27,446 | 11,696 | 42.6 | |
| Sa2 | 2020 | 18,442 | 8,516 | 46.2 |
| 2021 | 18,481 | 984 | 5.3 | |
| 2022 | 18,481 | 9,017 | 49.3 | |
| 2023 | 18,481 | 4,944 | 26.8 | |
| 2024 | 18,480 | 4,901 | 26.5 | |
| Sa3 | 2020 | 11,701 | 8,028 | 68.6 |
| 2021 | 10,090 | 2,985 | 29.6 | |
| 2022 | 10,090 | 4,116 | 40.8 | |
| 2023 | 10,090 | 2,838 | 28.1 | |
| 2024 | 10,092 | 2,577 | 25.5 | |
| Sa4 | 2020 | 13,175 | 2,743 | 20.8 |
| 2021 | 13,202 | 658 | 5.0 | |
| 2022 | 13,202 | 2,146 | 16.3 | |
| 2023 | 13,202 | 2,047 | 15.5 | |
| 2024 | 13,203 | 2,109 | 16.0 |