Introduction
Agricultural landscapes are not merely spaces for food production; they are vital foundations that provide diverse ecosystem services to human society. Rice-growing regions, in particular, not only provide food for humans but also offer winter food sources for birds through waste rice and rice straw after harvest (Lancaster & Askren, 2023). In paddy ecosystems, waterfowl and rice harvest residues (spilled rice, rice straw) are closely interconnected. Fallen rice left after harvesting serves as a critical food resource for key bird species like the Bean Goose (Anser fabalis) (Greer et al., 2009).
The Geumgang (River) estuary is a key site within the East Asian-Australasian Flyway (EAAF) Partnership, serving as a wintering or stopover site for hundreds of thousands of waterfowl annually. Overseas studies indicate that conservation methods such as leaving rice straw intact enhance rice residue preservation and increase waterfowl access to food (Bird et al., 2000; Kross, 2006). Waterfowl foraging activities also accelerate rice straw decomposition, contributing to improved soil health. As a certain level of waterfowl density is recognized as important for habitat maintenance (Havens et al., 2009; Miller et al., 2010), maintaining and managing food resources in agricultural lands is vital for migratory bird conservation, and the interaction between rice paddies and waterfowl can serve as an effective management strategy.
Payments for ecosystem services as a policy tool
Payments for ecosystem services (PES) are presented as a policy tool for linking agriculture and biodiversity conservation. PES is defined as “a system whereby at least one buyer voluntarily and conditionally compensates at least one provider for land use that delivers clearly defined environmental services” (Wunder, 2005). Such a system can institutionally realize mutual benefits between production and conservation by providing farmers with economic incentives for ecosystem conservation (Bird et al., 2000).
As an internationally recognized policy tool, PES programs are evaluated based on key elements such as cost-effectiveness, goal-oriented design, stakeholder participation, and systematic monitoring and performance. PES implemented in various countries reflects local characteristics through strategies like differential payments and opportunity cost reflection. However, the lack of transparency in fund management and scientific performance monitoring is noted as a limitation in implementation (Pham et al., 2015; Yost et al., 2020). In Korea, indicator-based evaluation systems and cost-effectiveness-based compensation are being proposed for the forestry and agriculture sectors (Ahn, 2013; Jung & Park, 2022).
Current status and research gap
PES-based rice straw retention projects are being implemented in several migratory bird arrival areas in Korea. Leaving rice straw in paddy fields enhances the preservation of fallen rice and contributes to the supply of winter forage resources (Yoo et al., 2008). However, quantitative research on how this management practice affects the conservation of waterfowl populations remains insufficient. The specific effects of rice straw retention on fallen rice conservation and forage resource maintenance have not been clearly verified.
For the conservation of wintering birds and waterfowl, securing food sources and maintaining habitat functionality are essential (Yoo et al., 2008). Domestic studies demonstrate that preserving winter rice straw and fallen rice is linked to maintaining overwintering bird populations and that forming spatial networks of core habitats and migration corridors is important (Shim et al., 2024). Research is underway to quantify habitat value through Ecosystem Service Indicators and avian community analysis (Choi et al., 2024).
Study objectives
There is an ecological link between rice residue conservation and bird food sources. However, quantitative evaluations of how rice straw retention projects affect waterfowl food provision remain limited. This study investigates the amount of fallen rice retained at a rice straw retention project site in Napo-myeon, Gunsan City, near the Geumgang (River) estuary, and analyzes the impact on maintaining food resources for waterfowl during winter. This study represents an empirical evaluation of domestic PES effectiveness and will provide foundational data for establishing future policies linking agricultural management and migratory bird conservation.
Materials and Methods
Study site
The study targeted cultivated paddy fields in Napo-myeon, Gunsan-si, Jeollabuk-do, which had undergone land consolidation (Fig. 1). The study site, a migratory bird arrival area, is located along the Geumgang (River). It is the area where the rice straw retention project, aimed at providing food for wintering birds, was implemented. This project covered the area from the northern bank of the Geumgang (River) to the southern boundary of Local Road 706. In 2024, the survey year, the contracted area for rice straw retention in the target region was 1,813,536 square meters. The total cultivated rice paddy area in the target region was 3,525,042 square meters, with the rice straw retention area accounting for 51.5% of the total paddy area.
Survey and analysis methods
The study sites comprised a total of 4 locations and 8 plots. Each set consisted of one plot of rice paddy with straw retention and one adjacent non-retention plot, allowing for comparative analysis of fallen rice counts between the two types of paddies. To minimize the impact of fallen rice loss due to waterfowl foraging activity, sites were selected in areas close to residential areas and roads where human disturbance was expected to reduce bird activity. In such locations, two adjacent plots (one project and one non-project) separated by a farm road were chosen. The survey randomly selected 20 quadrats measuring 20×20 cm per field, totaling 160 quadrats, to determine the number of fallen rice grains. Field surveys were conducted over two days, December 17-18, 2024. Survey results were analyzed for group differences across four pairs (A0 vs. A1, B0 vs. B1, C0 vs. C1, D0 vs. D1), naming the four points A through D, project plots as 1, and non-project plots as 0.
Statistical analysis involved assessing normality of the fallen rice data for each group using the Shapiro-Wilk test (Shapiro & Wilk, 1965). Since the analysis confirmed non-normal distribution in all groups (P<0.05), the Mann-Whitney U test was used to analyze differences between groups (Mann & Whitney, 1947). When significant differences between groups were identified, the effect size (r) was additionally calculated to quantify the practical significance of the difference. The calculated effect size was interpreted according to Cohen’s (1992) criteria: approximately 0.1 indicates a small effect, ~0.3 a medium effect, and ~0.5 a large effect.
Results
Descriptive statistics
The descriptive statistics for the number of fallen rice grains surveyed in the target area paddies are shown in Table 1. The analysis revealed that paddies under the rice straw retention project (1) generally showed a higher number of fallen rice grains compared to non-project paddies (0). At all sampling points (A, B, C, D), the median for the project field was significantly higher than the median for the non-project field. Notably, at point D, the median for the non-project field (0) was very low at 1.0, while the project field (1) showed a median of 11.5, demonstrating the substantial impact of rice straw retention. Overall, the data distribution showed the mean higher than the median, indicating a tendency for fallen rice to concentrate in specific quadrats. Notably, D1 exhibited high variability, encompassing a wide range (2-201) and including extreme outliers (144, 201). The boxplot (Fig. 2) visually presents a distinct difference in fallen rice distribution between project and non-project fields.
Intergroup difference analysis
The difference in fallen rice counts between rice fields with straw retention (1) and adjacent non-project fields (0) was analyzed using the Mann-Whitney U test (Table 2). The analysis revealed that in all four pairs, the fallen rice count in the rice straw retention project field (1) was statistically significantly higher (P<0.05) than in the non-project field (0). Furthermore, the calculated effect size (r) showed a ‘Large Effect’ (close to or exceeding 0.5) in the pairs A0 vs. A1 (0.467), C0 vs. C1 (0.542), and D0 vs. D1 (0.790). The B0 vs. B1 (0.386) pair also exceeded 0.3, showing a ‘Medium to Large Effect.’ This quantitatively demonstrates that the effect of rice straw retention on fallen rice preservation is substantial. The highest effect size was observed at site D (r=0.790), indicating that the effect of preserving fallen rice in the project field (D1) is very large compared to the extremely low number observed in the non-project field (D0).
Discussion
The results of this study empirically demonstrate that the rice straw retention project implemented in the Geumgang (River) estuary region has a highly significant effect on providing a food source for waterfowl. Not only did the project fields show a significantly higher number of fallen rice grains compared to non-project fields in all comparison pairs, but the magnitude of this difference (effect size r=0.467-0.790) was also statistically significant. Based on the median values, the difference in fallen rice counts between project and non-project fields ranged from a minimum of 3 times (Site C) to a maximum of 11 times (Site D). This result aligns with prior studies in California and Arkansas, USA. Bird et al. (2000) and Havens et al. (2009) also reported that post-harvest field management practices caused over threefold differences in waterfowl food source availability. Notably, the largest effect size (r=0.790) was observed in the comparison with non-project paddies (D0), where rice straw residues were nearly absent. This suggests that without rice straw retention, fallen rice either exists below levels accessible to wintering birds or is rapidly depleted.
The ecological significance of these findings lies in demonstrating that agricultural activities themselves can generate ecosystem services for wintering bird conservation. The foraging activities of waterfowl create ‘mutual benefits’ that positively impact not only the utilization of fallen rice but also agricultural productivity (Bird et al., 2000). During the feeding activities of waterfowl in paddy fields, rice straw residues are physically shredded and come into contact with the soil, accelerating the decomposition rate of the straw. This reduces the cost and labor required for farmers to manage rice straw during the next year’s tillage, making rice straw retention a sustainable management practice that simultaneously achieves biodiversity conservation goals and benefits farmers. This mutually beneficial structure is also significant in the Geumgang (River) estuary, as it serves as a key stopover site along the EAAF (Greer et al., 2009).
This study represents a rare instance of quantitatively and empirically evaluating the effectiveness of domestic PES schemes. As noted in previous studies, the success of PES programs hinges on systematic monitoring and scientific performance evaluation (Engel et al., 2008; Yost et al., 2020). The empirical results of this study hold the following policy implications. First, it numerically demonstrates that the Napo-myeon rice straw retention project is effectively achieving its goal of providing a wintering bird food source. Second, the quantitative benchmarks established in this study can be utilized for future cost-effectiveness evaluations of PES projects. This will aid in selecting optimal participating regions and determining compensation levels within limited budget constraints (Jung & Park, 2022). Third, the quadrat survey and random sampling method employed in this study present a repeatable and comparable monitoring methodology. This can serve as a practical solution to the challenge of “the absence of a scientific performance monitoring system.”
This study has the following limitations. First, the data used for analysis were obtained from short-term field surveys and do not reflect changes in fallen rice quantities throughout the entire period of wintering bird arrival. Additionally, environmental variables such as distance to water sources, human disturbance, and agricultural management history were not fully controlled in the site selection process, which could influence the availability of fallen rice.
Therefore, it is necessary to quantitatively measure the residual amount and depletion rate of fallen rice through periodic surveys (at least once per month) and to understand the foraging pattern during the wintering period. Furthermore, the study focused on evaluating fallen rice without directly examining its correlation with biological indicators such as the arrival timing and population size of actual waterfowl populations. Consequently, follow-up research should track waterfowl populations across the entire wintering season to establish quantitative relationships between the rice straw retention program, annual variations in food availability, waterfowl population dynamics, and the relationship between foraging sites and resting habitats.
In conclusion, verifying the institutional effectiveness of domestic PES policies during their initial growth phase is crucial for enhancing policy credibility and scalability. The quantitative empirical results of this study are expected to strengthen the basis for decision-making by policy makers and provide the scientific foundation for domestic PES projects to the academic community. If a broad-scale, long-term monitoring and evaluation system is established in the future, the rice straw retention project under the PES schemes will become a sustainable development model for wintering bird conservation and rural ecosystem management in Korea.
Author Contributions
Conceptualization: TC. Data curation: HM, BK, TL, TC, PJ. Formal analysis: TC, PJ. Funding acquisition: TC. Investigation: HM, BK, TL, TC, PJ. Writing – review & editing: TC, PJ.
Funding
This work was supported by a grant from the National Institute of Ecology (NIE) funded by the Ministry of Climate, Energy, Environment (MCEE) of the Republic of Korea (NIE-B-2025-03).
References
Havens, J.H., Kaminski, R.M., Davis, J.B., and Riffell, S.K. (2009, March 1). Winter abundance of waterfowl and waste rice in managed Arkansas rice fields. Proceedings of the Annual Conference of the Southeastern Association of Fish and Wildlife Agencies (Vol. 63 pp. 41-46). Journal of the Southeastern Association of Fish and Wildlife Agencies.
Lancaster, J.D., and Askren, R.J. (2023). Understanding waterfowl: balanced diets_Waterfowl eat a variety of foods throughout the year to meet changing nutritional needs. Ducks Unlimited. Retrieved September 16, 2025 from https://www.ducks.org/conservation/waterfowl-research-science/understanding-waterfowl-balanced-diets-.
Shapiro, S.S., and Wilk, M.B. An analysis of variance test for normality (complete samples). Biometrika, 52, 591-611. https://doi.org/10.2307/2333709
Figures and Tables
Fig. 1
Location of study sites. Each of the four sites comprised one control (0) and one treatment (1) plot, labeled A, B, C, and D.
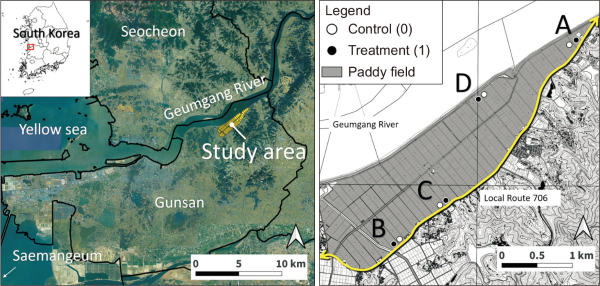
Fig. 2
Boxplot comparison of fallen rice counts by site (A-D) and pair. (A), (B), (C), and (D) refer to Fig. 1.
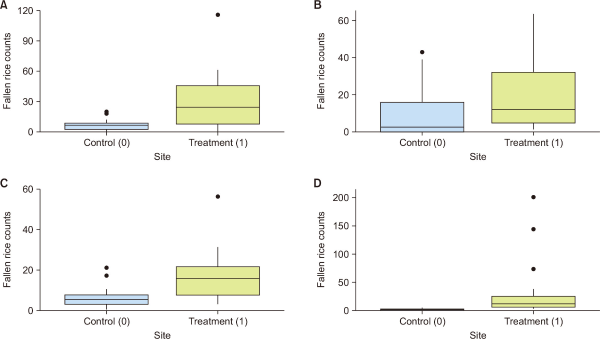
Table 1
Descriptive statistics of fallen rice counts per quadrat at study sites (n=20)
| Site | Group | Mean | Median | SD | Min | Max |
|---|---|---|---|---|---|---|
| A | 0 | 7.10 | 6.5 | 6.09 | 0 | 20 |
| 1 | 29.60 | 24.5 | 28.15 | 0 | 116 | |
| B | 0 | 10.60 | 2.5 | 15.00 | 0 | 43 |
| 1 | 21.65 | 12.0 | 20.70 | 1 | 64 | |
| C | 0 | 6.35 | 5.5 | 5.63 | 0 | 22 |
| 1 | 18.30 | 16.5 | 13.21 | 3 | 59 | |
| D | 0 | 1.40 | 1.0 | 1.60 | 0 | 22 |
| 1 | 31.45 | 11.5 | 51.85 | 2 | 201 |
Table 2
Mann-Whitney U test comparison of fallen rice counts by four paired sites
| Comparison pair | W value | P-value (two-tailed) |
Median 1 (treatment plot) |
Median 0 (control plot) |
Effect size (r) |
|---|---|---|---|---|---|
| A0 vs. A1 | 90.5 | 0.003138 | 24.5 | 6.5 | 0.467 |
| B0 vs. B1 | 109.5 | 0.014600 | 12.0 | 2.5 | 0.386 |
| C0 vs. C1 | 73.0 | 0.000607 | 16.5 | 5.5 | 0.542 |
| D0 vs. D1 | 16.5 | 5.865×10⁻⁷ | 11.5 | 1.0 | 0.790 |
Based on Cohen (1992), effect size (r) values of approximately 0.1, 0.3, and 0.5 indicate small, medium, and large effects, respectively.