Introduction
The rapid global expansion of urban areas accelerates habitat loss and fragmentation, leading to the isolation of habitats within cities and a reduction in biodiversity (Hagen et al., 2017). Many studies have predicted a significant future loss of biodiversity if this urban expansion continues (Newbold et al., 2015; Simkin et al., 2022). In response to this problem, the necessity of ecological restoration projects to restore degraded natural environments and recover ecological functions within cities has been internationally emphasized. The United Nations (UN) declared 2021-2030 as the UN Decade on Ecosystem Restoration, and both the Kunming-Montreal Global Biodiversity Framework (Convention on Biological Diversity, 2022) and the European Union (EU) Biodiversity Strategy for 2030 (European Commission, 2021) established ecological restoration as a key objective. In South Korea, many urban ecological restoration projects have been promoted, and institutional implementation of natural environment restoration projects was strengthened with the revision of the Natural Environment Conservation Act in 2021.
However, evaluations of the ecological effects of these restoration projects remain insufficient (Ji et al., 2024; Lee, 2023). In Korea, the Nature Garden (Jayeon-madang) ecological restoration project, promoted since 2012 as an ecological restoration initiative, has resulted in the completion of a total of 18 sites completed as of 2019 (Architecture and Urban Research Institute, 2019). However, research concerning the effectiveness of such restoration efforts is still lacking. Only a few studies have been reported to date, such as the heat reduction effect of urban ecological restoration sites (Choi et al., 2017), the origin of planted species (Lee et al., 2020), and comparison of wild bird assemblages before and after restoration (Kim et al., 2020).
Against this backdrop, this study surveyed wild bird assemblages to evaluate the restoration effects of an urban ecological restoration project. Wild birds serve as indicator species for measuring ecosystem health due to their high mobility and sensitivity to environmental changes (Gregory & van Strien, 2010). Habitat isolation and degradation caused by urbanization directly impact the movement routes, breeding, and foraging success of wild birds, resulting in a reduction in the abundance of specific species and the proliferation of a few species highly adapted to urban environments (Bellocq et al., 2017; McKinney, 2006; Valente-Neto et al., 2021). Prior research has focused on identifying factors influencing bird species composition, occurrence patterns, habitat structure, impervious surface cover, and landscape heterogeneity due to urbanization (Souza et al., 2019). These wild bird assemblage metrics are effective indicators for assessing the ecological quality and functionality of restored habitats.
Therefore, this study comparatively analyzed the wild bird assemblage structure between an artificially created urban ecological restoration site and its adjacent, existing natural forest ecosystem. The study site, Mt. Sorasan Nature Garden was established in 2015. This study aimed to identify the habitat functions and limitations of the restoration area linked to the adjacent pine forest for wild birds through surveys and analyses conducted during the initial restoration period (2017-2018). Furthermore, it sought to establish baseline data for long-term monitoring and provide scientific evidence for the improvement of ecological restoration projects.
Materials and Methods
Overview of the study sites
The study was conducted targeting the Mt. Sorasan Nature Garden, an urban ecological restoration site located in Iksan, Jeonbuk Special Self-Governing Province, and its adjacent forest (Fig. 1). The total survey area covered approximately 8 ha, comprising the restoration site (39,757 m2) and the adjacent forest (40,815 m2), which were nearly similar in size. The restoration site was previously an area of farmland, buildings, and reed wetlands. Following the restoration project, completed in December 2015, the site was configured as a mixed habitat including pine-dominant woody planting (44.8%) linked to the adjacent forest, grassland (20.1%), and wetland (24.9%). The main planted woody species included Pinus densiflora (24.2%), Chionanthus retusus (6.6%), Celtis sinensis (6.1%), and Sorbus alnifolia (2.6%), all of which supply preferred food sources for wild birds. At the time of the survey in 2017, the short period since restoration resulted in minimal tree growth and vegetation that exhibited a single-layered structure with sparse shrub layer planting. In contrast, the adjacent forest was a multi-layered woodland that distinctly contrasted with the restoration site. It was dominated by mature woody vegetation, accounting for approximately 90% of the area, primarily featuring Pinus densiflora (47.5%), Robinia pseudoacacia (11.8%), Prunus spp. (9.4%), and Quercus acutissima (7.9%), and possessed high vegetation volume across vegetation layers (Choi et al., 2019) (Table 1; Fig. 2).
Wild bird survey methods
The survey period was one year, from May 2017 to April 2018, with one day of surveying conducted monthly, totaling 11 surveys. The line-transect method was used, following a predetermined route after sunrise on clear days, and observed species were identified by sight with binoculars and by calls. The survey intensity was controlled by investigating the restoration site (4 ha) and the adjacent forest (4 ha), which are nearly similar in size, for the same amount of time (30 minutes each). The species name and abundance of all wild birds encountered during the survey were recorded, and species classification followed the National Species List of Korea (National Institute of Biological Resources, 2024).
Analysis methods
To compare the bird assemblage characteristics between the two habitats, the total species richness and total abundance for the overall period and by season were calculated. The Shannon–Weaver species diversity index (H’) was calculated to assess the diversity of each habitat. Furthermore, foraging guilds were analyzed to understand the influence of habitat structure on bird occurrence. Foraging guilds were categorized based on the primary foraging space and behavior: aquatic forager (AF), aerial insectivore (AI), bark/trunk forager (BF), foliage gleaner (FG), ground forager (GF), and omnivore/generalist (OG).
Multivariate statistical analysis was performed to quantitatively verify the differences in wild bird assemblage structure between the two habitats. Permutational multivariate analysis of variance (PERMANOVA), a non-parametric multivariate analysis of variance, was applied to test for statistically significant differences in the bird assemblage structure between the restoration site and the forest. This method is suitable for ecological data that does not satisfy the assumption of normality and is a robust method for testing differences between groups based on distance metrics. Non-metric Multidimensional Scaling (NMDS) was used to visually complement the PERMANOVA results and represent the degree of similarity between assemblages in a two-dimensional space. Finally, similarity percentages (SIMPER) analysis was performed to identify which species contributed most significantly to the observed differences in assemblage structure between the two habitats.
Results and Discussion
Comparison of wild bird assemblage characteristics
During the survey period, a total of 28 species (179 individuals) were observed in the restoration site and 30 species (156 individuals) in the forest, indicating a similar scale of occurrence between the habitats (Table 2). However, the overall Shannon–Weaver species diversity index (H’) was significantly higher in the forest (3.07) than in the restoration site (2.38), suggesting a more even occurrence of diverse species in the forest.
Seasonal comparison of assemblage characteristics revealed that the forest maintained relatively stable richness (17-20 species), abundance (83-109 individuals), and diversity (H’=2.51-2.68) across all four seasons. In contrast, the restoration site exhibited lower richness (12-16 species), abundance (71-101 individuals), and diversity (H’=1.59-1.99) compared to the forest, with a pronounced difference in richness and diversity, suggesting that the occurrence was concentrated in a few species. This result is attributed to the restoration site’s simple and open vegetation structure in its early stage, making it unstable for the habitation of diverse birds.
The foraging guild analysis showed a distinct difference in the utilization of foraging space between the two bird assemblages (Table 3). The mean abundance of GFs in the restoration site (36 individuals) was significantly higher than in the forest (21.25 individuals), although species richness was similar (4.25 vs. 4.50 species). This suggests that the simple vegetation structure and extensive grassland environment of the restoration site favored the habitation of GFs such as the tree sparrow (Passer montanus). Conversely, FG showed significantly higher richness (6.75 species) and abundance (34.75 individuals) in the forest compared to the restoration site (4.25 species, 29.25 individuals). Furthermore, BFs, such as woodpeckers, were much more abundant in the forest (3 species, 4.50 individuals) compared to the restoration site (1 species, 1.50 individuals). These results show that the multi-layered forest structure functions as a stable habitat for birds by providing diverse foraging spaces and shelter, and they are consistent with previous studies indicating that the vertical structure of vegetation is closely related to the habitation of diverse bird species (Blinkova & Shupova, 2017; de Toledo et al., 2012).
Notably, AF were observed only in the restoration site (0.75 species, 2.50 individuals). This suggests that the wetlands and aquatic systems created by the restoration project function as novel habitats that are not found in the adjacent forest.
Comparison of assemblage structure between habitats
The PERMANOVA analysis revealed a statistically significant difference in the bird assemblage structure between the restoration site and the adjacent forest (P=0.001). Habitat type explained approximately 28.4% of the total bird assemblage variation (R2=0.2839) (Table 4). This result was visually corroborated through the NMDS analysis (Fig. 3). The low stress value of the NMDS plot (0.1837846) indicates that the plot reliably represents the actual data distances (Clarke, 1993).
In the plot, the restoration site and the forest were clearly separated into two groups along the horizontal NMDS1 axis, with the forest concentrated in the positive direction and the restoration site in the negative direction, showing the difference in bird assemblages based on habitat type. Notably, the restoration site samples were more dispersed compared to the relatively clustered forest samples, indicating the instability of the restoration assemblage, i.e., larger monthly and seasonal differences in assemblage structure.
SIMPER analysis was conducted to identify which species contributed most significantly to these differences (Table 5). The analysis showed that the difference in assemblages between the restoration site and the forest was largely contributed by the vinous-throated parrotbill (Suthora webbiana), tree sparrow (Passer montanus), azure-winged magpie (Cyanopica cyanus), oriental turtle dove (Streptopelia orientalis), and great tit (Parus major), in order of decreasing contribution. The top 10 contributing species accounted for approximately 77% of the total assemblage difference.
By comparing the average abundance (Group A [Restoration] vs. Group B [Forest]), Suthora webbiana (12.909 vs. 3.455) and Passer montanus (12.636 vs. 0.455) showed markedly higher occurrence in the restoration site, while Cyanopica cyanus (4.818 vs. 10.545), Streptopelia orientalis (3.727 vs. 8.000), and Parus major (0.364 vs. 5.545) had higher abundance in the adjacent forest. The adjacent forest provided a stable habitat for birds like Parus major that in the canopy and on branches. In this forest, breeding individuals and nests of species including Parus major, Streptopelia orientalis, and the black-naped oriole (Oriolus chinensis) were observed during the spring. Furthermore, the goldcrest (Regulus regulus), which primarily occurs in coniferous forests, was frequently observed from autumn to spring, highlighting the forest’s function as a stable habitat. Conversely, in the restoration site, despite the planting of various food-providing species such as Chionanthus retusus, the occurrence of urban-adapted species like Passer montanus was concentrated, contributing most significantly to the difference from the forest assemblage. This dominance of urban-adapted species reflects biotic homogenization due to urbanization (McKinney, 2006), suggesting that the restoration site provides an environment favorable to urban-adapted species, distinct from the forest assemblage.
Furthermore, analysis of species exclusively observed in each habitat showed that water-dependent birds, such as the Eurasian teal, common kingfisher, and black-crowned night heron, were observed only in the restoration site. This highlights the effect of creating new habitat space in the isolated urban ecosystem. This aligns with prior research indicating that increasing landscape heterogeneity, such as creating water spaces in urban areas, positively influences bird species richness (Morgan et al., 2025). Conversely, species requiring multi-layered forest habitats and stable food sources, such as the black-naped oriole (Oriolus chinensis) and brown hawk-owl (Ninox scutulata), were founded only in the adjacent forest. This indicates that the adjacent forest performs a unique and crucial ecological function not offered by the restoration site, acting as a core habitat for disturbance-sensitive species.
Conclusion
This study found a statistically significant difference in the wild bird assemblage structure between the Mt. Sorasan urban ecological restoration site and the adjacent forest ecosystem. The complex, multi-layered structure of the adjacent forest was identified as a stable habitat for diverse birds. The restoration site, while in its early stage, showed limitations in supporting the bird species found in the adjacent forest due to its open and simple vegetation structure. However, the restoration site also played a positive role by creating a previously lacking aquatic ecosystem in the surrounding area, providing a new habitat for water-dependent birds.
These results emphasize that the goal of ecological restoration should not be limited to simply increasing the area of green space. It should, from a long-term perspective, prioritize the creation of complex, multi-layered habitats that consider the process of ecological succession, and enhance connectivity with the adjacent natural ecosystem.
The Mt. Sorasan restoration site requires management to ensure that the planted trees can mature into a stable forest environment. Given that various food-providing plants have been already planted, it is expected that the site will facilitate the influx of diverse wild bird species from the adjacent forest and expand their habitat space in the future.
This study is significant because it empirically evaluated the effectiveness of an urban ecological restoration project through direct comparison with an adjacent natural ecosystem. The findings can be used as baseline data to present short-term restoration outcomes and the direction for long-term progress.
However, the study was limited to a short-term, one-year survey, and included only a single restoration site and its adjacent forest, precluding analysis of the influence of the surrounding landscape context and connectivity to the wider region. Future research is suggested to conduct long-term monitoring to track changes in bird assemblages following vegetation succession. It is also recommended to additionally investigate the influence of the landscape context surrounding the restoration site on bird communities.
Author Contributions
Conceptualization: TYC. Data curation: TYC, DK, HGM. Formal analysis: TYC, JC, HGM. Funding acquisition: JC. Investigation: TYC, HGM. Writing – original draft: TYC. Writing – review & editing: TYC.
Funding
This work was supported by a grant from the National Institute of Ecology (NIE) funded by the Ministry of Climate, Energy, Environment (MCEE) of the Republic of Korea (NIE-B-2025-03, NIE-B-2019-08).
References
Architecture and Urban Research Institute (AURI). (2019). Ecological rest area (Nature Garden) creation project. AURI. Retrieved October 28, 2025 from https://www.aurum.re.kr/Policy/PolicyOffice.aspx?pcode=K01.
Convention on Biological Diversity (CBD). (2022). Decision adopted by the Conference of the Parties to the Convention on Biological Diversity. 15/4. Kunming-Montreal Global Biodiversity Framework. CBD. Retrieved October 28, 2025 from https://www.cbd.int/doc/decisions/cop-15/cop-15-dec-04-en.pdf.
European Commission: Directorate-General for Environment. (2021). EU biodiversity strategy for 2030: bringing nature back into our lives. Publications Office of the European Union. Retrieved October 28, 2025 from https://data.europa.eu/doi/10.2779/677548.
Morgan, M.C., Forster, R., Hopkins, C.R., and Gómez, A. (2025). Just add water: urban blue spaces increase avian richness and functional diversity. bioRxiv. https://doi.org/10.1101/2025.06.18.660350
National Institute of Biological Resources (NIBR). (2024). National species list of Korea. NIBR. Retrieved October 28, 2025 from https://species.nibr.go.kr/home/mainHome.do?cont_link=002&subMenu=002001&contCd=002001001.
Figures and Tables
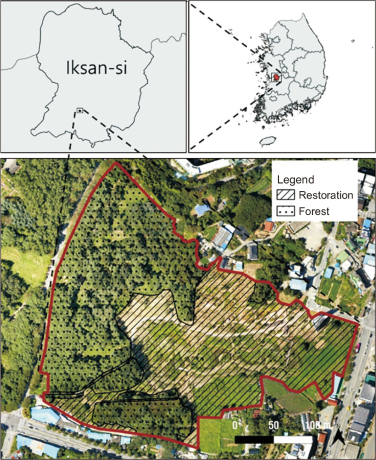
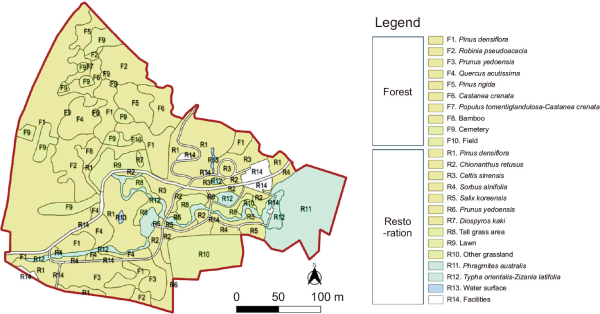
Fig. 3
Non-metric Multidimensional Scaling (NMDS) plot of avian assemblages comparing restoration and forest. Each point represents a sampling event, with numeric labels indicating the month of survey.
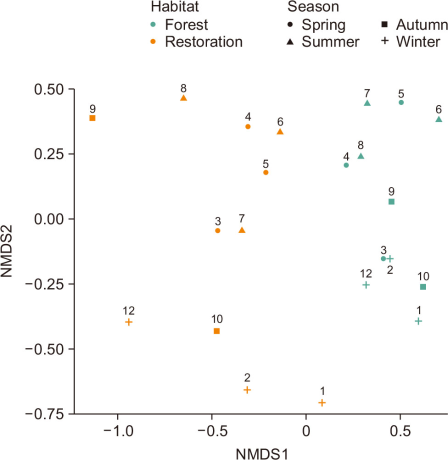
Table 1
Area and ratio by actual vegetation type
| Type | Area (m2) | Ratio (%) | |
|---|---|---|---|
| Forest | F1. Pinus densiflora | 19,241 | 47.5 |
| F2. Robinia pseudoacacia | 4,797 | 11.8 | |
| F3. Prunus yedoensis | 3,809 | 9.4 | |
| F4. Quercus acutissima | 3,209 | 7.9 | |
| F5. Pinus rigida | 2,300 | 5.7 | |
| F6. Castanea crenata | 2,295 | 5.7 | |
| F7. Populus tomentiglandulosa-Castanea crenata | 482 | 1.2 | |
| F8. Bamboo | 590 | 1.5 | |
| F9. Cemetery | 3,846 | 8.7 | |
| F10. Field | 246 | 0.6 | |
| Subtotal | 40,815 | 100.0 | |
| Restoration | R1. Pinus densiflora | 9,624 | 24.2 |
| R2. Chionanthus retusus | 2,625 | 6.6 | |
| R3. Sorbus alnifolia | 1,026 | 2.6 | |
| R4. Celtis sinensis | 2,407 | 6.1 | |
| R5. Salix koreensis | 1,158 | 2.9 | |
| R6. Prunus yedoensis | 862 | 2.2 | |
| R7. Diospyros kaki | 104 | 0.3 | |
| R8. Tall grass area | 2,247 | 5.6 | |
| R9. Lawn | 1,546 | 3.9 | |
| R10. Other grassland | 4,179 | 10.5 | |
| R11. Phragmites australis | 6,349 | 16.0 | |
| R12. Typha orientalis-Zizania latifolia | 3,399 | 8.6 | |
| R13. Water surface | 155 | 0.4 | |
| R14. Facilities | 4,076 | 10.3 | |
| Subtotal | 39,757 | 100.0 |
Table 2
Maximum species richness and abundance of avian assemblages in restoration and forest
| Restoration | Forest | ||||||||||
|---|---|---|---|---|---|---|---|---|---|---|---|
|
|
|
||||||||||
| Spring | Summer | Autumn | Winter | Total | Spring | Summer | Autumn | Winter | Total | ||
| Richness | 14 | 13 | 12 | 16 | 28 | 20 | 19 | 17 | 19 | 30 | |
| Abundance | 82 | 101 | 71 | 82 | 179 | 84 | 91 | 83 | 109 | 156 | |
| Species diversity (H’) | 1.99 | 1.59 | 1.72 | 1.95 | 2.38 | 2.68 | 2.51 | 2.52 | 2.67 | 3.07 | |
Table 3
Species richness and abundance of avian foraging guilds in restoration and forest
| Restoration | Forest | ||||
|---|---|---|---|---|---|
|
|
|
||||
| Richness | Abundance | Richness | Abundance | ||
| AF | 0.75±0.96 | 2.50±4.36 | 0.00±0.00 | 0.00±0.00 | |
| AI | 0.50±0.58 | 0.75±0.96 | 0.50±0.58 | 0.75±0.96 | |
| BF | 1.00±0.82 | 1.50±1.29 | 3.00±0.00 | 4.50±1.00 | |
| FG | 4.25±0.50 | 29.25±14.82 | 6.75±0.96 | 34.75±7.76 | |
| GF | 4.25±1.50 | 36.00±20.61 | 4.50±1.29 | 21.25±8.46 | |
| OG | 3.00±0.82 | 14.00±5.23 | 4.00±0.00 | 30.50±3.87 | |
| Total | 13.75±1.71 | 84.00±12.46 | 18.75±1.26 | 91.75±12.04 | |
Table 4
PERMANOVA results for avian assemblages comparing restoration and forest
| Factor | df | Sum of Sqs | R2 | F | P-value |
|---|---|---|---|---|---|
| Group | 1 | 1.3281 | 0.2839 | 7.9291 | 0.001 |
| Residual | 20 | 3.3498 | 0.7161 | ||
| Total | 21 | 4.6779 | 1 |
Table 5
Species contributions to avian assemblages dissimilarity based on SIMPER analysis
| Top 10 contributing species | Avg. Contrib. | Contrib./SD | ava | avb | P-value | Cum. Contrib. |
|---|---|---|---|---|---|---|
| Suthora webbiana | 0.112 | 1.036 | 12.909 | 3.455 | 0.206 | 0.154 |
| Passer montanus | 0.110 | 0.895 | 12.636 | 0.455 | 0.067 | 0.304 |
| Cyanopica cyanus | 0.085 | 1.518 | 4.818 | 10.545 | 0.007 | 0.421 |
| Streptopelia orientalis | 0.059 | 1.271 | 3.727 | 8.000 | 0.006 | 0.502 |
| Parus major | 0.054 | 1.907 | 0.364 | 5.545 | 0.001 | 0.577 |
| Hypsipetes amaurotis | 0.039 | 1.454 | 0.909 | 4.182 | 0.002 | 0.63 |
| Pica pica | 0.032 | 1.539 | 1.818 | 4.273 | 0.001 | 0.674 |
| Regulus regulus | 0.029 | 0.744 | 0.000 | 2.636 | 0.002 | 0.714 |
| Aegithalos caudatus | 0.022 | 0.901 | 0.545 | 2.091 | 0.094 | 0.744 |
| Periparus ater | 0.021 | 0.874 | 0.091 | 2.000 | 0.007 | 0.773 |