Introduction
The Geum Estuary, where the Geum River meets the Yellow Sea, is a major estuarine ecosystem in Korea characterized by a wide tidal range and extensive mudflats (Kang et al., 2022). Since the construction of the Geum River estuarine barrage in 1990, water flow has been regulated, yet the area remains strongly influenced by tidal energy, resulting in the formation of a gently sloping intertidal landscape.
Bolboschoenus planiculmis (B. planiculmis), a perennial halophyte belonging to the Cyperaceae family, is widely distributed across East Asia, Central Asia, and Central Europe (Hroudová et al., 2009). This species typically grows to a height of 20-100 cm and is morphologically distinguished by its triangular stems and bifid styles, unlike the trifid styles of other Bolboschoenusspecies found in Europe (Hroudová et al., 2009). It exhibits strong clonal propagation ability, enabling survival under unfavorable conditions and rapid expansion when conditions improve (Oborny et al., 2012).
In East Asia, B. planiculmis functions as a key species in estuarine ecosystems, providing critical ecological services. Its tubers, formed at the ends of rhizomes, serve as an essential winter food source for endangered migratory birds such as the Siberian crane (Grus leucogeranus), the swan goose (Anser cygnoides), and various Cygnusspecies (Liu et al., 2016). Additionally, the species contributes to sediment stabilization and wave attenuation, facilitating soil retention and nutrient cycling in estuarine wetlands (IPCC, 2021; Yang et al., 2021).
However, populations of B. planiculmis have been declining globally due to habitat disturbances driven by climate change and human activities. In monsoon-dominated regions of East Asia, alterations in seasonal inundation regimes caused by embankment construction and land reclamation have significantly affected the survival and growth of this species (Yang et al., 2021). An et al. (2022) reported an optimal water depth range for B. planiculmis growth between 11.2 and 36.1 cm, with substantial reductions in growth observed under inundation conditions beyond this range.
Several studies have investigated the plant’s tolerance to flooding. For instance, Yang et al. (2021) found that seasonal flooding supports better growth than continuous inundation, while Yang (2019) demonstrated high growth rates and photosynthetic efficiency at shallow water depths (0-5 cm). More recently, Park et al. (2024) revealed that B. planiculmis adjusts its biomass allocation between above- and below-ground structures to cope with flooding stress.
While the ecological importance of B. planiculmis in estuarine biogeochemical cycling is well documented, quantitative studies on the environmental determinants of its spatial distribution—particularly those focusing on large-scale patch formation—remain limited.
In a 2024 field survey, extensive patches of B. planiculmis were observed across the Geum Estuary, suggesting that the local hydrological environment may provide favorable conditions for its establishment and growth. Nevertheless, the specific environmental factors that shape this distribution, and the hydrological and geomorphological characteristics that favor its occurrence, have yet to be quantitatively assessed.
Therefore, this study aims to investigate the distribution characteristics of the large-scale B. planiculmis patches observed in the Geum River Estuary in 2024 and to identify the environmental factors determining these patterns. Specifically, this study seeks to address the following ecological questions: (1) Under what inundation conditions does B. planiculmis gain a competitive advantage? (2) What is the influence of spatial proximity to tidal creeks on patch establishment? To answer these questions, this study will: (1) quantify the precise spatial distribution and area of B. planiculmis patches through drone aerial photography; (2) measure key hydrological and topographical variables including water depth, daily inundation duration, and minimum distance to tidal creeks at each patch location; and (3) statistically analyze the relationships between these environmental factors and patch distribution and area.
This approach goes beyond simply describing distribution patterns; by quantitatively characterizing the habitat preferences of B. planiculmis, it enhances our understanding of the ecological niche of brackish-water halophytes and is expected to provide essential baseline data for future saltmarsh ecosystem conservation and restoration strategies. In particular, the findings from this study can be applied to identify key manageable hydrological variables (e.g., inundation time, drainage systems) in estuarine restoration projects and to predict changes in halophyte communities under sea-level rise scenarios associated with climate change.
Materials and Methods
Study area
The Geum Estuary, located at the confluence of the Geum River and the Yellow Sea, forms the boundary between Seocheon-gun in Chungcheongnam-do and Gunsan-si in Jeonbuk Special Self-Governing Province. The study area encompassed the section between the Geum River estuarine barrage and the Dongbaek Bridge, where large-scale patches of B. planiculmis are extensively distributed (Figs. 1, 2).
Data collection
Drone survey
High-resolution orthophotos were acquired using a Phantom 4 Pro V2 drone (SZ DJI Technology Co., Ltd., Shenzhen, China) in October 2024 across areas where B. planiculmis patches were densely distributed near the Geum River estuarine barrage. Flight missions were configured to achieve 80% image overlap, yielding 720 images at 150 m altitude.
Collected images were processed using Pix4DMapper software (Pix4D, Lausanne, Switzerland) following a standard photogrammetric workflow (initial alignment → point cloud generation → orthomosaic construction), resulting in georeferenced orthophotos with ~30 cm spatial resolution (Table 1). Geometric correction was performed using reference imagery from the National Geographic Information Institute ( https://www.ngii.go.kr/) to minimize distortions from flight variations.
Environmental variable
Patch elevation and hydrological characteristics were derived from multiple sources (Table 1). Patch elevation data relative to mean sea level (MSL) were obtained from bathymetric surveys conducted by the Korea Hydrographic and Oceanographic Agency (KHOA) and interpolated to patch centroids using the nearest neighbor method in Quantum Geographic Information System (QGIS).
Tidal water level data at 1-minute intervals were acquired from the KHOA Janghang tide gauge station (Sinchang-ri, Janghang-eup, Seocheon-gun; N 36°00'25", E 126°41'15"), located approximately 5 km from the study site. All tidal elevations were referenced to MSL using the station’s datum.
The spatial distribution, patch size, and number of B. planiculmis patches and tidal creeks were extracted from orthophotos using QGIS 3.4v.
Data analysis
To evaluate the relationship between B. planiculmis patch formation and hydrological conditions, a multivariate logistic regression analysis was performed. Daily inundation duration for each patch was calculated by combining patch elevation with 1-minute interval tidal water level records from June 2024:
Daily inundation duration (h day–1) = [Σ(minutes when tidal level≥patch elevation)/60]/30, where tidal data consisted of 43,200 observations at 1-minute intervals over the 30-day period in June 2024 (n=30 days).
The dependent variable was binary: patches in the top 25% area quantile were classified as “large patches” (coded as 1), while all others were coded as 0. Independent variables included daily inundation duration (hours), minimum distance to tidal creeks (meters), and water depth (meters). All continuous variables were standardized (z-scores) for comparability.
Multicollinearity was assessed using the variance inflation factor (VIF). If VIF values exceeded 5 for multiple variables, the variable most strongly collinear with inundation time—namely, elevation—was excluded from the final model.
The final model was fitted using a generalized linear model with a binomial distribution and logit link function. Model performance was evaluated using the area under the curve (AUC) derived from 5-fold cross-validation. To assess spatial autocorrelation in model residuals, Moran’s I statistic was calculated using the 10 nearest neighbors (k=10). Significant residual spatial dependence was detected, indicating the need for spatial correction (Dormann et al., 2007). Consequently, spatial eigenvector mapping (SEVM) was applied to account for spatial structure in the data (Griffith & Peres-Neto, 2006).
Result
Patch size and distance distribution
A total of 1,344 B. planiculmis patches were identified in the Geum Estuary. Patch sizes ranged from 0.52 m2 to 79.06 m2, with a mean of 10.23 m2 and a standard deviation of 8.57 m2. The cumulative area of all patches was 13,754 m2 (Fig. 3). The distance from the terrestrial embankment (marking the boundary between land and intertidal zone) to patch centroids ranged from 163 m to 681 m, with an average of 351 m (Fig. 4). Notably, patch occurrence was most concentrated around 346 m from the embankment.
Distance to tidal creeks
The spatial relationship between patch centroids and tidal creeks is illustrated in Fig. 5. The minimum distance from patch centroids to the nearest tidal creek ranged from 0.1 m to 74.6 m, with a mean of 10.7 m, a median of 7.6 m, and a standard deviation of 10.3 m. In terms of distance categories: 517 patches (38.5%) were located within 5 m, 280 patches (20.8%) within 5-10 m, 199 patches (14.8%) within 10-15 m, 141 patches (10.5%) within 15-20 m, 96 patches (7.1%) within 20-25 m, 42 patches (3.1%) within 25-30 m, 25 patches (1.9%) within 30-35 m, 18 patches (1.3%) within 35-40 m, and 26 patches (2.0%) were found beyond 40 m. Overall, more than 74% of patches were located within 15 m of a tidal creek, and over 90% were within 25 m (Fig. 6).
Bathymetry and inundation characteristics
The elevation (relative to MSL) of B. planiculmis patches ranged from –1.15 m to –0.44 m, with a mean of –0.91 m, a median of –0.92 m, and a standard deviation of 0.17 m (n=1,344; Fig. 7). Based on tidal records from June 2024, daily inundation duration ranged from 13.7 hours to 15.4 hours, with a mean of 14.9 hours, a median of 15.0 hours, and a standard deviation of 0.3 hours. Most values were concentrated between 14.7 and 15.2 hours per day (Fig. 8).
Statistical results
In the final multivariate logistic regression model, daily inundation duration and distance to tidal creeks were used as explanatory variables, while water depth was excluded due to multicollinearity. When water depth was included together with inundation duration and distance as candidate predictors, its VIF was 8,210, whereas VIFs for inundation duration and distance were both 1.09 (Table 2), indicating severe collinearity between depth and inundation.Inundation duration showed a significant positive association with the formation of large patches (top 25% area) (odds ratio [OR]=1.75, 95% confidence interval [CI]=1.51-2.05, P<0.001), indicating that a one-standard-deviation increase in inundation time increased the odds of forming a large patch by approximately 75%.
In contrast, the distance to tidal creeks was not a statistically significant predictor (OR=1.03, 95% CI=0.91-1.17, P=0.581) (Table 3). Model performance, as evaluated by 5-fold cross-validation, showed an average AUC of 0.624±0.030. Partial dependence analysis revealed that the predicted probability of large patch occurrence increased consistently with inundation duration, holding other variables at their median values (Fig. 9).
Additionally, Moran’s I statistic indicated significant spatial autocorrelation in model residuals (Moran’s I=0.028, P<0.05). However, after applying SEVM, residual spatial dependence was effectively eliminated (Moran’s I=0.002, P=0.45), and model performance improved (AUC increased from 0.624 to 0.650).
Discussion
Key findings and ecological implications
This study quantitatively analyzed the relationship between the distribution of B. planiculmis patches and environmental variables in the Geum Estuary during 2024. A total of 1,344 patches were identified, covering an area of 13,754 m2, indicating that the estuary provides favorable conditions for the establishment of this species. Notably, daily inundation duration emerged as a key determinant of patch size (OR=1.75, P<0.001), offering important insight into the species’ ecological strategies.
The positive correlation between inundation duration and patch size suggests that B. planiculmis may possess a distinct ecological strategy compared to other halophytes. The observed mean inundation duration of 14.9 hours per day (13.7-15.4 hours), which accounts for approximately 62% of the day, represents a prolonged submersion period that is more extreme than the optimal depth range (11.2-36.1 cm) proposed by An et al. (2021). This implies either a high flood tolerance in the local population or a competitive advantage gained through suppression of other species under prolonged inundation.
Comparison with previous studies
The water depth range observed in this study (–1.15 m to –0.44 m) significantly deviates from the optimal range (5-10 cm) reported by Zheng et al. (2023). While this discrepancy may partly reflect differences in tidal datum or site-specific conditions, it also indicates that the ecological plasticity of B. planiculmis may be greater than previously recognized. Ma et al. (2024) reported that seasonal flooding is more favorable than continuous inundation; however, our findings show that B. planiculmis can successfully establish even under near-continuous inundation averaging 14.9 hours per day.
The lack of a statistically significant relationship between patch size and distance to tidal creeks (P=0.584) was unexpected. Tidal creeks are generally thought to play important roles in seed and propagule dispersal, drainage, and nutrient input (Ma et al., 2024; Zheng et al., 2023). However, despite over 74% of patches being located within 15 m of a creek, no significant association with patch size was found. This suggests that, in the Geum Estuary, most patches may already lie within the influence range of creeks, rendering inundation duration a more dominant driver than creek proximity.
Spatial distribution and environmental gradients
The concentration of B. planiculmis patches at an average distance of 351 m (ranging from 163 m to 681 m) from the embankment, with peak density around 346 m, implies that this elevation zone within the intertidal gradient offers optimal conditions for establishment. Considering the findings of Park et al. (2024), which emphasize biomass allocation adjustment under flooding stress, this elevation may represent a balance point for optimal above- and below-ground growth.
The significant spatial autocorrelation detected in model residuals (Moran’s I=0.028, P<0.05) suggests that patch formation is influenced not only by environmental variables but also by spatial processes. These may include local clonal expansion (Oborny et al., 2012) or spatial constraints on seed dispersal. The improved model performance after applying SEVM, with AUC increasing from 0.624 to 0.650, confirms the importance of incorporating spatial structure in species distribution modeling.
Limitations and future directions
Several limitations should be noted. First, this study is based on data from a single year and therefore does not capture temporal dynamics. Long-term monitoring is required to understand seasonal and interannual variability in B. planiculmis distribution. Second, the model’s predictive power (AUC=0.624) remains moderate, suggesting that unmeasured variables such as soil characteristics, nutrient levels, interspecific competition, or disturbance frequency may also be influential. A more integrated modeling approach incorporating these factors is recommended.
Third, water depth was excluded from the final model due to high multicollinearity with inundation duration (VIF>5). Although this exclusion was statistically justified, it underscores the need for more refined hydrological indicators that consider tidal cycles in future studies. Fourth, this study focused on current patch distribution and did not directly assess initial colonization mechanisms or dispersal processes.
Conservation and management implications
The results of this study provide concrete guidance for the management of B. planiculmis habitats in the Geum Estuary. Patch size and establishment probability increased within the observed inundation window of 13.7-15.4 h day–1 (mean 14.9 hours), suggesting that maintaining a similar range of daily inundation duration during the growing season may enhance the stability of existing stands under the regulated hydrological regime of the estuarine barrage. In practice, barrage gate operations and environmental-flow releases should be configured so that key B. planiculmis zones are neither exposed for prolonged periods nor subjected to near-continuous flooding.
The spatial thresholds identified here can also be used to prioritize restoration and protection zones. Patches were concentrated in a mid-intertidal belt approximately 300-400 m seaward of the embankment and within 15 m of tidal creeks, providing practical criteria for selecting planting sites and evaluating the effects of dredging or construction projects. Because the tubers of B. planiculmis are an important food resource for migratory waterbirds and other wildlife (Liu et al., 2016), maintaining healthy stands through appropriate hydrological management may improve habitat quality for these species. At the same time, the potential impacts of rapid B. planiculmis expansion on mudflat structure and other halophytes should be monitored, and the inundation and spatial thresholds reported here can be used to limit further encroachment where necessary.
Conclusion
This study quantitatively demonstrated that the distribution of B. planiculmis patches in the Geum River Estuary is determined by two key environmental factors: inundation duration and distance to tidal creeks. Inundation duration was identified as the primary factor determining patch size and survival, with longer daily inundation periods significantly increasing the probability of patch establishment (OR=1.75, P<0.001). This finding provides crucial baseline data for understanding the ecological niche of brackish-water halophytes. Distance to tidal creeks was the key factor shaping the spatial distribution pattern of patches, with 74% of all patches located within 15 m of tidal creeks, suggesting that tidal creeks serve as primary conduits for seed and vegetative propagule dispersal.
Beyond these general patterns, the study identified specific hydrological and spatial thresholds—namely, an inundation window of approximately 13.7-15.4 h day–1 and a mid-intertidal belt 300-400 m seaward of the embankment and within 15 m of tidal creeks—that can be directly applied to habitat management and restoration planning. These thresholds offer practical guidance for designing barrage operation schemes, selecting restoration sites, and evaluating the potential impacts of future hydrological alterations.
Taken together, these findings can be used to predict and manage saltmarsh ecosystem changes under future climate change and anthropogenic disturbances. The large-scale B. planiculmis patches observed in the Geum River Estuary in 2024 represent a case of rapid ecosystem transformation that can occur when environmental conditions align with these two ecological characteristics (inundation tolerance and tidal-creek dependence). This highlights the dynamic nature of estuarine ecosystems and underscores the critical need for predictive, evidence-based, and adaptive ecosystem management strategies.
Author Contributions
Conceptualization: CY, JC. Formal analysis: CY. Investigation: CY, HYY. Methodology: CY. Supervision: JC. Visualization: CY. Writing – original draft: CY. Writing – review & editing: HYY, JC.
Figures and Tables
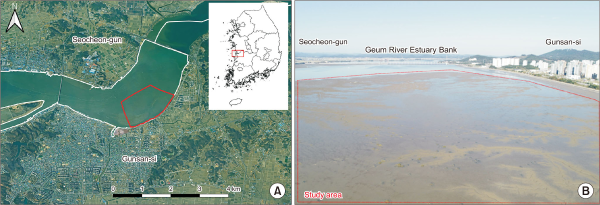
Fig. 2
Visual characteristics of B. planiculmis in the Geum Estuary. (A) Tidal flat patches formed by B. planiculmis colonies during low tide. (B) Spikelet of a collected specimen. (C) Triangular cross-section of the culm. B. planiculmis, Bolboschoenus planiculmis.
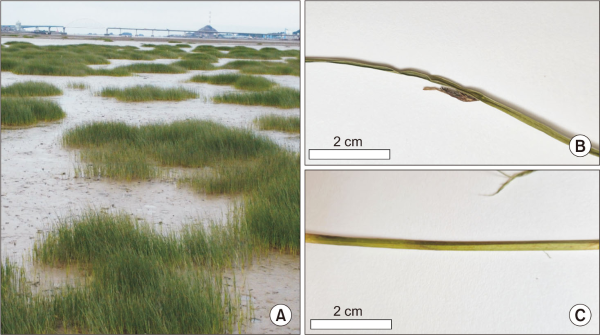
Fig. 3
Distribution of B. planiculmis patches (red) on the drone-derived orthomosaic; 1,344 patches totaling 13,754 m2. B. planiculmis, Bolboschoenus planiculmis.
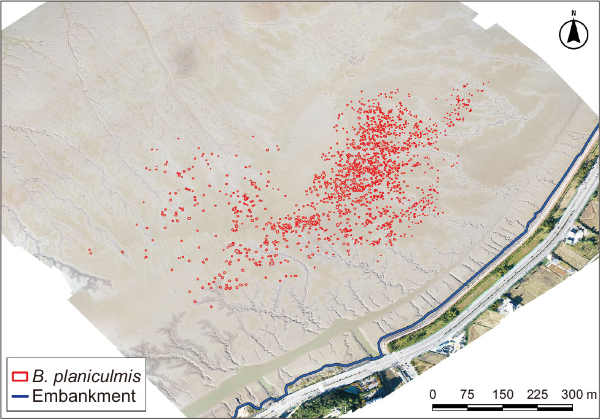
Fig. 4
Histogram of distances from patch centroids to the terrestrial embankment, highlighting a mode near 346 m.
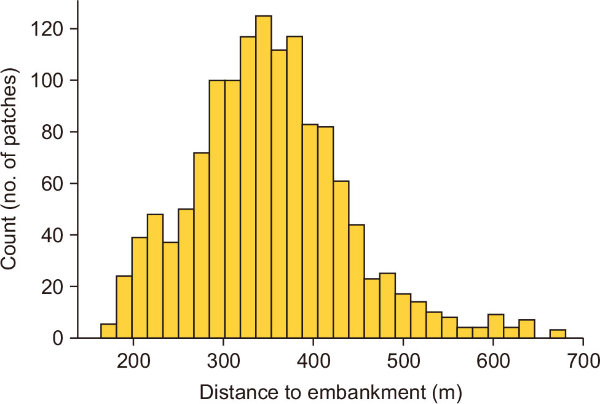
Fig. 5
Spatial relationship between patch centroids (red) and tidal creek (blue). B. planiculmis, Bolboschoenus planiculmis.
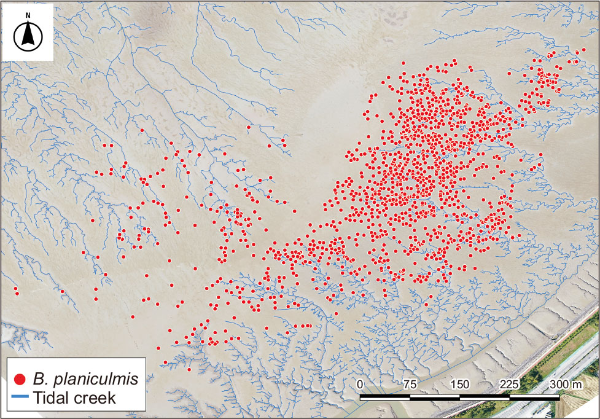
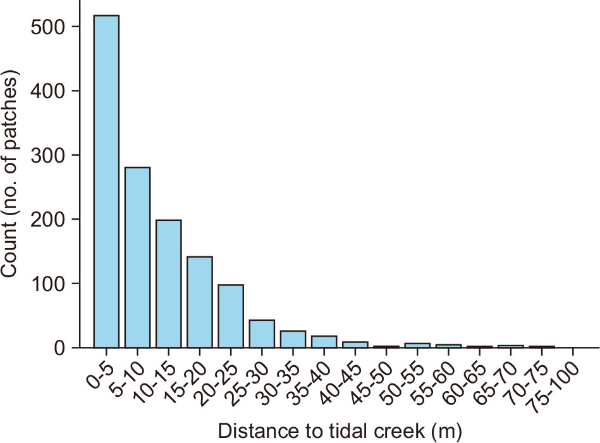
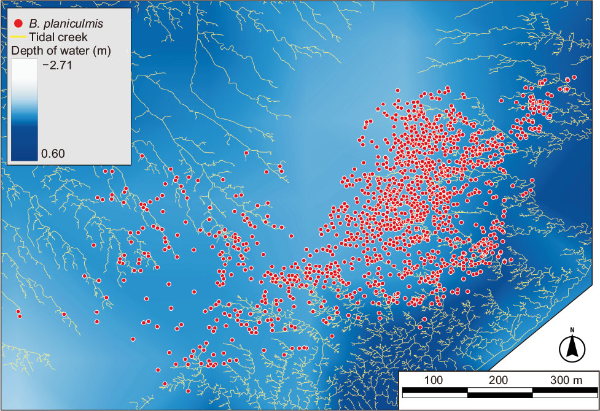
Fig. 8
Bathymetric map (MSL) overlaid with patch locations. MSL, mean sea level; B. planiculmis, Bolboschoenus planiculmis.
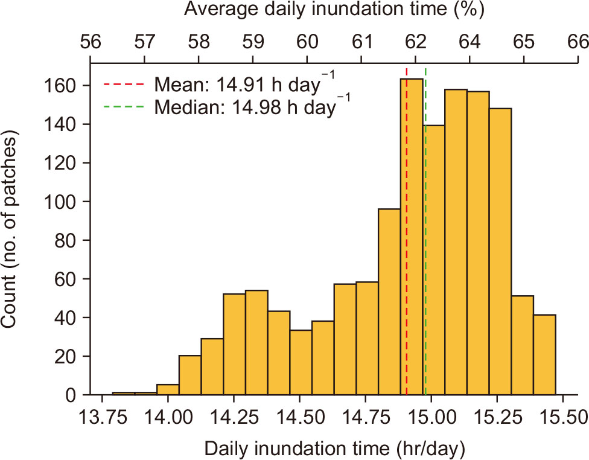
Fig. 9
Partial dependence of the predicted probability of large patches on inundation time with other covariates fixed at medians.
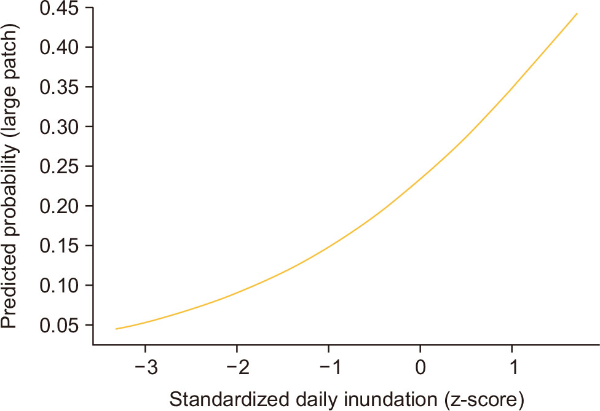
Table 1
Data sources and processing methods for environmental variables
| Variable | Data source | Temporal/spatial resolution | Processing method |
|---|---|---|---|
| Patch area | Drone imagery (Phantom 4 Pro V2; SZ DJI Technology Co., Ltd., Shenzhen, China) | 30 cm GSD, flight 150 m altitude, 80% overlap, fast mode | Pix4D Capture+orthomosaic (Pix4Dmapper; Pix4D, Lausanne, Switzerland) |
| Patch elevation | KHOA bathymetric data | Point data | Interpolated to patch centroids using nearest neighbor method |
| Tidal level | Janghang tide gauge (KHOA) | 1-minute interval, June 2024 | Converted to MSL |
| Inundation duration | Derived | Daily | Calculated from elevation+tidal data |
| Distance to creek | Digitized creek network | 30 cm GSD (digitized creek network from drone orthomosaic) | Euclidean distance in QGIS |
Table 2
Multicollinearity diagnostics (VIF) for candidate predictors considered in the multivariate logistic regression
| Variable | VIF |
|---|---|
| Depth* | 8,210 |
| Inundation | 8,214 |
| Distance | 1.09 |
Table 3
Multivariate logistic regression for predictors of large B. planiculmis patches (top-quartile area)
| Variable | Coef | OR | CI_low | CI_high | P-value* |
|---|---|---|---|---|---|
| Const | –1.18 | 0.30 | 0.27 | 0.35 | <0.001 |
| Inundation | 0.56 | 1.75 | 1.51 | 2.05 | <0.001 |
| Distance | 0.03 | 1.03 | 0.91 | 1.17 | 0.581 |
Coef: logistic regression coefficient (log-odds), OR: exp (coef). Continuous variables were standardized (z-score) prior to analysis, and ORs represent changes per 1 SD increase. Outcome: large patch (area ≥75th percentile)