Introduction
Invasive species pose a significant environmental challenge, as they can disrupt the ecological equilibrium of native ecosystems and contribute to biodiversity loss (Gentili et al., 2021). These species exert a deleterious effect on native species through habitat competition, ecosystem disruption, and disease transmission, with some species even dominating ecosystems due to rapid population growth (Gherardi, 2006; Lee & Park, 2019).
The red swamp crayfish (Procambarus clarkii) demonstrates resilience in environments with low oxygen levels and exhibits a notable tolerance to variations in water temperature (Loureiro et al., 2015; U.S. Fish & Wildlife Service, 2015). These characteristics are the reason why P. clarkii has experienced such rapid proliferation, while native crayfish population levels have declined due to specific environmental changes (Chucholl, 2013). P. clarkii demonstrates a broad spectrum of dietary preferences and behavioral patterns that differ significantly from native crayfish. When competing for food and habitat, P. clarkii has been observed to physically push out native crayfish (Pintor et al., 2008). P. clarkii is notable for its short generation time and high reproductive rate, reproducing multiple times a year. In contrast, native crayfish species frequently undergo reproductive cycles of only one or two instances per year, a pattern that hinders the preservation of their population sizes (Momot, 1995). Consequently, P. clarkii exhibits superior environmental adaptability, competitiveness, and reproductive capacity compared to native crayfish. This dynamic suggests a gradual displacement of the native crayfish population by P. clarkii within the local ecosystem.
Furthermore, P. clarkii carries Aphanomyces astaci and the white spot syndrome virus, which have been known to cause mass mortality among native crayfish populations. In particular, A. astaci is an aquatic pathogenic fungus that causes crayfish plague. Several crayfish species native to North America, including P. clarkii, have been documented as exhibiting resistance to this fungus (Alderman et al., 1990). However, native crayfish species in Europe and Asia lack resistance to this fungus. Consequently, when infected, mass mortalities and sharp population declines have been reported (Brady et al., 2024; Filipová et al., 2013; Kawai & Kobayashi, 2005; Nakata et al., 2002). Given the shared habitat of P. clarkii and native crayfish, the pathogen responsible for the decline in native crayfish populations is, most likely, transmitted through the water. This has led to the hypothesis that P. clarkii may become the sole surviving species within the ecosystem (Gherardi, 2006; Holdich et al., 2009).
P. clarkii was initially documented in South Korea in 1987 at Yongsan Family Park in Seoul. Subsequently, in 2006, minimal numbers of this species were reported in certain regions (Kim et al., 2006). The official establishment of P. clarkii within the domestic ecosystem was confirmed in Jiseokcheon Stream, located in Naju City, Jeollanam-do, in 2019 (Kim et al., 2019). Subsequently, the species has expanded its habitat to include the Yeongsangang, Seomjingang, and Mangyeonggang Rivers. Furthermore, its presence has been substantiated in minor streams near urban areas, including Cheongju City (Lee & Park, 2019; Park et al., 2020). In response, the Ministry of Environment of South Korea classified P. clarkii as an ecosystem-disrupting species in 2019 and is promoting research on population monitoring and preventing its spread.
A quantitative understanding of the distribution and population dynamics of invasive species is essential for effectively controlling it (Ricciardi, 2007; Stohlgren & Schnase, 2006). However, quantitative research on the population of P. clarkii in South Korea is lacking. Existing studies have focused on reporting whether it has established itself in natural ecosystems and the number of individuals captured (Choi et al., 2021; Jung et al., 2022; Kim et al., 2019; Park et al., 2020). Population size can be estimated using the capture-recapture method (Efford & Fewster, 2013; Petit & Valiere, 2006). However, given the dispersal of P. clarkii along Korean rivers, this method has limitations, as it can only provide information for specific, limited areas. The population size of P. clarkii is subject to significant fluctuations. These are influenced by factors such as predation pressure, survival rates of juvenile crayfish, and environmental changes. This underscores the limitations of rudimentary population surveys in formulating long-term control strategies.
A complete census is the most accurate method, but implementing it is challenging due to time, labor, and resource constraints. Furthermore, it poses a risk of habitat destruction and raises ethical concerns (Krebs, 2009; Sutherland, 2006). Therefore, a novel approach is imperative for predicting long-term changes in the P. clarkii population and analyzing stable population fluctuation patterns.
In this study, we used the number of individuals captured in a specific area to estimate the total population across the entire river section, rather than surveying the entire area. Specifically, habitat characteristics were established along the entire river section as spatial information, and population size was estimated by comparing these with points where capture surveys were conducted. The population size was estimated by combining information on the number of individuals caught per trap collected during field surveys with information on the potential P. clarkii habitats. The aim of this study was to conduct a quantitative assessment of the P. clarkii population, thereby contributing to the establishment of effective control strategies.
Materials and Methods
Survey area setting
The survey area included the Yeongsangang River and Jiseokcheon Stream in South Korea, encompassing locations where P. clarkii was captured during surveys conducted between 2021 and 2023 (Fig. 1). The analysis subjects were 86 wetlands located along the channels of two rivers and their surrounding areas within the study area.
The spatial units for population estimation in this study were gravel-and-sand bar wetlands and abandoned channel wetlands. The wetlands in the study area were extracted using the medium-class land cover map from the Ministry of Environment, encompassing rivers and their surrounding natural grasslands, artificial grasslands, inland wetlands, natural bare lands, artificial bare lands, and inland water bodies. Subsequently, aerial photographs were analyzed to differentiate between the gravel-and-sand bar wetlands and the old river channel wetlands within the aforementioned land cover types. A total of 86 wetlands were selected for the study as subjects within the designated study area. Survey results from 19 of these wetlands yielded population data, and information on the number of traps utilized in the surveys was obtained from eight of these wetlands and used in the research.
Population data
The P. clarkii capture data utilized in this study were derived from the survey results of the National Institute of Ecology. As a part of this study, more than 40 surveys in rivers and abandoned channel wetlands between 2021 and 2023 were conducted (Eum et al., 2024). We used the results from 26 surveys in which the number of traps utilized for capture was documented. Crayfish were captured using commercially available umbrella-shaped hexagonal automatic traps with six entry holes, commonly used for shrimp, crayfish, and other small crustaceans. The traps consisted of a collapsible hexagon frame supporting netting with six funnel entrances that allowed animals to enter easily but hindered exit, thereby improving capture efficiency. The typical physical dimensions of each trap were approximately 0.8-1.0 m across the flats (length×width) and 0.3-0.4 m in height, with a nylon mesh netting of approximately 10-15 mm mesh size suitable for capturing crayfish while allowing water flow and reducing bycatch. Traps were baited and deployed in shallow, low-flow areas within each wetland and were left in place for a standard soak time before retrieval; the number of traps deployed per survey was recorded and used for subsequent density and abundance estimation. In instances where P. clarkii was captured, yet the number of traps could not be confirmed, these data were not utilized for population estimation. Conversely, the utilization of these data was restricted exclusively to the establishment of the study area.
Environmental information of wetlands
We constructed a database of environmental factors for each wetland to predict the potential habitat suitability and population size of P. clarkii (Table 1). The selection of these variables was intended to provide a comprehensive reflection of the known ecological characteristics of P. clarkii. The variables were subsequently classified into four categories. Wetland characteristics included wetland type (type), wetland area (area), and the area actually available for P. clarkii to inhabit (avail_area). Additionally, in the land cover category, gravel-and-sand bar wetlands (lc_bar) and bare lands (lc_bare) were used as variables. Regarding hydrological features, open water, permanent surface water bodies (lc_water), and the density of channels and pools within wetlands (channel_pool) were considered. Additionally, ecological factors included the abundance of food sources (food) and the accessibility of terrestrial predators (predation_risk). P. clarkii is classified as omnivorous, meaning it consumes a wide variety of plant material, detritus, and animal prey. The diet of the subject consists of aquatic insects, freshwater shrimp, and aquatic plants in substantial quantities. Consequently, the abundance of food sources (food) and the accessibility of terrestrial predators (predation_risk) that constrain them were incorporated as significant ecological factors. The terrestrial predators under consideration included humans, otters, and leopard cats. The proximity to mountainous regions or roads was determined to be indicative of favorable accessibility. Food availability (food) was coded as a binary variable (0/1) to represent relative resource abundance within each wetland. Based on consistent visual interpretation of aerial/satellite imagery and land-cover/topographic maps, wetlands showing clear indicators of abundant food resources (e.g., well-developed aquatic vegetation and/or visible organic detritus/accumulated organic matter) were coded as food=1, whereas wetlands lacking such indicators were coded as food=0. Predation risk (predation_risk) was coded as a categorical variable (2/3) to reflect the accessibility of terrestrial predators (e.g., humans, Eurasian otter, and leopard cat). Wetlands were classified as predation_risk=3 (high) when roads and/or mountainous/forested areas were judged to be adjacent to or in close proximity to the wetland, indicating high accessibility of terrestrial predators, and as predation_risk=2 (low) when such features were judged to be distant or not readily accessible. This 2-3 coding was retained to distinguish predation_risk from other binary (0/1) variables, and the same interpretation criteria were applied consistently across all wetlands. The crayfish population data were subsequently organized into the following categories: the number of individuals captured using traps (pop_trap), the number captured using nets (pop_net), the number of traps set (trap), the number of individuals captured per trap (pop_1trap), and the total number of individuals captured (pop_total). The environment variables constructed in this manner were organized into categorical or numerical data formats. The environmental information for each wetland constructed in this study is presented in the table in Appendix 1.
These variables were selected based on the biological and ecological characteristics of P. clarkii, which inhabits environments characterized by stagnant or slow-flowing currents, such as slow-moving streams, wetlands, and irrigation ditches, and burrows into the substrate for shelter in dry or high-temperature conditions. Therefore, topographical and hydrological variables, including wetland type, area, habitable space area, distribution of gravel-and-sand bars and bare lands, open water surfaces, and water body morphology, are essential for describing crayfish habitat conditions. Furthermore, given the omnivorous nature of P. clarkii and its reliance on a diverse array of food sources, including aquatic insects, plants, and other organisms, the abundance of these resources was identified as a pivotal ecological factor. Concurrently, the accessibility of terrestrial predators such as humans, otters, and leopard cats was identified as a pivotal factor influencing population viability. This factor was duly reflected in the study’s findings. Meanwhile, P. clarkii has demonstrated remarkable environmental resilience, with high tolerance for a broad range of conditions, including water temperatures ranging from 0°C to 40°C and pH levels from 5.8 to 10.0. Consequently, water quality parameters were not incorporated as variables in this study.
The investigator constructed all variables through meticulous observation of various materials, including aerial photographs, land cover and topographic maps, and other pertinent documentation. In particular, the “area available for habitation (avail_area)” was constructed through vectorization. The “avail_area” refers to the area within each wetland that meets the environmental conditions necessary for the red swamp crayfish to inhabit. We delineated the primary habitat of P. clarkii as sections characterized by slow-moving currents and relatively shallow depths (approximately 40-100 cm), based on a literature review (Park et al., 2020). Accordingly, shallow-water areas surrounding gravel-and-sand bar wetlands were designated as potential habitats. In addition, areas meeting the following conditions were excluded from the “area available for habitation.” Areas where the ground surface is covered with concrete or paving materials due to frequent human access or structures such as walkways, roads, bridges, buildings, parking lots, or construction sites (Fig. 2A) and areas where the soil is heavily compacted were excluded because they were deemed unsuitable for the burrowing and habitation of P. clarkii (Fig. 2B). The process of classifying wetlands in the study area into “area available for habitation” and “unsuitable areas” was performed by vectorizing the Vworld satellite imagery.
Study methods
We estimated the P. clarkii population size using two steps. First, the environmental data from the 16 wetlands where P. clarkii were captured and those from other wetlands were used to assess the probability of P. clarkii occurrence using machine learning techniques. Second, the population size within the area available for habitation within wetlands was estimated based on the number of traps and the number of individuals captured across eight wetlands.
In the first step, we used a Random Forest (RF) algorithm to estimate the probability of P. clarkii occurrence in wetlands (Fig. 3). Among the 86 wetlands, all 19 wetlands with capture records were included as presence (positive) sites, and 19 wetlands were randomly selected from the 67 wetlands without capture records as absence (negative) sites, yielding a total of 38 wetlands for model development. This subsampling of absence sites was a strategic choice to mitigate the severe imbalance between presence and absence data and to enhance model robustness. When all absence sites were used, the model was disproportionately exposed to negative cases, which hindered learning of the occurrence characteristics of P. clarkii and resulted in a strong bias toward predicting absence, ultimately lowering model performance. Accordingly, we constructed a more balanced dataset by limiting the number of absence sites. Model performance was evaluated using the area under the receiver operating characteristic curve area under the curve (AUC).
The selected dataset was partitioned into five folds, and the model was trained and validated using a 5-fold cross-validation framework. Model training was conducted iteratively, and performance was assessed after at least five training runs. A total of 100 repetitions was performed; if the AUC did not meet the threshold of 0.7, model parameters were adjusted and the training procedure was repeated. Repeating cross-validation and prediction 100 times was intended to minimize stochastic variation arising from random data partitioning and model instability and thereby improve the reliability of the results. Because model performance can vary depending on random train/test splits and hyperparameter initialization even with the same dataset, we averaged predictions across repeated runs to obtain more stable and generalizable estimates. Specifically, for each repetition, predicted probabilities were generated for the validation (out-of-fold) data; these out-of-fold predicted probabilities were accumulated for each wetland and then averaged to produce the final occurrence probability.
In the second step, population size in wetlands with potential P. clarkii occurrence was estimated by converting trap catches to areal density using an effective sampling-area approach. Trap catches were obtained using the umbrella-shaped hexagonal automatic traps with six entrances described in Section 2.2; however, the catch was assumed to represent individuals originating from within a surrounding capture radius (r), such that the effective sampling area was πr2. Following Acosta and Perry (2000), we set r=4 m and the capture probability P=0.265, and estimated density (individuals m–²) from the mean number of individuals captured per trap ( ) as (Eq. 2). Total abundance for each wetland was then calculated by multiplying D by the area available for habitation (a): (Eq. 3). The population size in the eight wetlands with P. clarkii capture data was calculated by multiplying the number of individuals per trap by the area with potential habitat. For the remaining wetlands lacking P. clarkii capture data, population size was calculated as a range using the median, 25th percentile, and 75th percentile values of density (individuals m–2) converted from trap catches (Eq. 2) (Fig. 4).
The sphere of influence of the trap had to be assumed to estimate the population size in the surrounding area based on the number captured in the trap. On average, P. clarkii moves at approximately 33 cm/min, enabling it to traverse several hundred meters within 24 hours. While P. clarkii can travel distances exceeding several kilometers, it is reasonable to consider that in everyday activities, mobility ranges from tens to hundreds of meters. However, it appeared to be an unreasonable assumption that the individual captured in the installed trap traveled approximately several hundred meters (for instance, 400 meters) to reach that location. It is more logical to hypothesize that the individual was captured within a collection radius of several to tens of meters. Therefore, the number of individuals trapped was estimated using the following equation (Eq. 3).
E[c] is the expected average number of individuals captured. This number can be expressed as the product of the total number of individuals Nlocal actually present within the capture radius of the trap and the probability of capturing one individual (Eq. 1). Expressing the area (m2) of the trap’s capture radius (r) as πr2, the density per unit area D could be calculated as shown in Eq. 2. The analysis used the mean of the actual number of individuals captured , rather than the expected number of individuals captured E[c]. Therefore, if the area (m2) of the potential habitat was a, the total population estimate Ntotal was the product of the density D per unit area and the area a, as shown in Eq. 3.
In the analysis, the trap’s capture radius (r) and capture probability (p) are important variables for estimating population size. The value of this variable was determined based on the findings of a study conducted by Acosta and Perry (2000). Through experimental recapture of released Florida crayfish (P. alleni) in traps set within a specific radius, it was confirmed that the probability of recapture decreased significantly with distance from the release point. Furthermore, the effective capture radius of a single trap was estimated to be approximately 4 m, and the capture probability based on the capture radius was expressed using the following log-linear model (Eq. 4). This study applied this approach, setting the r- and P-values to 4 m and 0.265, respectively. This implied that the number of individuals captured in the study area corresponded to approximately 25.6% of P. clarkii present within a 4 m radius (area of approximately 50 m²).
Results
Estimation of potential wetland habitats
Through 100 iterations of the RF model and 5-fold cross-validation, the effectiveness of the sampling strategy for negative data during model implementation was confirmed via the receiver operating characteristic curve. A random subsampling of 19 negative points balanced against 19 positive points yielded an AUC of 0.836 in the experiment (subsampled dataset). In contrast, results obtained using all negative point data and simply altering the composition of the training and data each time it was repeated yielded an AUC of 0.831 (full dataset). The difference between the two results was minimal (0.005). However, this indicated that the sampling strategy affected the performance of the model (Fig. 5).
The use of the subsampled dataset demonstrated that the potential habitat suitability for P. clarkii tended to be determined by the size of the stagnant water areas within wetlands and the available area for habitation (channel_pool, avail_area, area), as well as the water persistence (lc_water). Table 2 presents the results of evaluating the importance of variables using Mean Decrease Gini. The channel_pool (4.70), avail_area (2.85), and area (2.68) variables had the highest importance scores. This finding suggested that the area of the wetland and the information extracted by crayfish as area available for habitation played a crucial role in determining the presence of the habitat. lc_water (1.41) also emerged as a significant variable, demonstrating that a consistently water-rich environment was a crucial factor for the habitat of P. clarkii. The predation_risk (0.46) and open_water (0.44) variables were less important than the previous three variables, yet they still exhibited a significant effect. However, the type, food, lc_bar, and lc_bare variables showed low importance.
These results indicated that habitat sustainability and the potential for species establishment could increase with sufficient space and stable water resources. This suggested that despite the high environmental tolerance of P. clarkii, the importance of area and water resources as fundamental habitat conditions remained a key limiting factor.
Variables that were initially deemed to have minimal importance (type, food, lc_bar, and lc_bare) could, in fact, exert a non-negligible influence on the habitat of P. clarkii. Conversely, the low importance ratings observed could be attributed to limitations in the variable construction process, simplifications in variable definitions, or constraints in the data resolution. For example, the abundance of food sources (food) can vary significantly depending on the timing of the survey or the season. Similarly, the distribution of gravel-and-sand basins and bare lands (lc_bare, lc_bar) can also vary in reliability depending on the classification accuracy of the spatial data. Therefore, while the importance results indicate which variables the model used to assess habitat potential, variables with low values are not necessarily irrelevant for habitat prediction.
Fig. 6 shows the estimated potential habitat probability of P. clarkii using an RF model. Habitat probability was categorized into three intervals: low (0.12-0.50), moderate (0.50-0.80), and high-probability (0.80-1.00). Comparing model-based prediction results with actual occurrence points from field surveys revealed that some wetlands were distributed in the high-probability (0.80-1.00) area, consistent with their actual presence, suggesting that the model partially reflects field occurrence characteristics. Conversely, several confirmed wetlands were classified as having a moderate (0.50-0.80) or low probability (0.00-0.50). This was interpreted as arising from variability in field data, uncertainties in the process of establishing environmental variables, and limitations in the training data. Therefore, the map presented in this study should be used as a reference to understand the spatial trends in relative habitat potential rather than as definitive evidence of absolute habitat distribution.
A spatial analysis of wetlands with high potential for P. clarkii occurrence revealed that those developed over a larger area on the sedimentary slope exhibit a comparatively higher predicted probability. Abandoned channel wetlands also appeared as areas with high predicted probability. These regional characteristics correspond with the well-established ecological traits of P. clarkii, which necessitate stable water resources and sufficient habitat space, while concurrently providing environmental conditions that offer hiding places and diverse food sources. Therefore, these areas may have been designated as habitats with a high probability of the proliferation and dispersal of P. clarkii.
However, these predictions inherently contain uncertainty due to the construction process of the environmental variables used, data resolution, and sample size. For instance, variables such as the abundance of food sources or predation pressure exhibit significant spatiotemporal variability, and their actual influence may have been underestimated during the simplification process. The calculation of variables with low importance does not necessarily imply that they lack ecological significance. This outcome may stem from limitations in the model structure and variable definitions. Therefore, using this map as a foundation for determining absolute distribution is not sufficient. However, considering the efficiency of the simulation, it is likely to serve as a reference material indicating the relative trend of potential habitats for P. clarkii.
Table 3 shows the relationship between actual occurrence and predicted probability of occurrence. Of the 86 wetlands examined, P. clarkii was confirmed in 19. Of those, three were classified as high probability, thirteen as moderate probability, and three as low probability. This suggested that while the model successfully predicted some actual occurrence points as high or moderate probability, there were still occurrence points classified as low probability. Meanwhile, for the 67 wetlands where occurrence was not confirmed, 10 were classified as high probability, seven as moderate probability, and 50 as low probability.
In this study, we estimated the population size of P. clarkii in wetlands classified as high- to moderate-probability habitats or those where their presence had been confirmed in previous surveys. A total of 13 high-probability wetlands were estimated, and P. clarkii was actually observed in three. Moderate-probability wetlands comprised 13 confirmed wetlands and 7 wetlands yet to be identified (Table 3). We selected a total of 36 wetlands as population estimation points, comprising 33 wetlands included in two classes and an additional three wetlands predicted as low probability, but where actual observations were made. The estimated target was finalized through a careful consideration of both the probability of occurrence based on the analysis results and whether it was observed during the field survey.
Population size estimation
We estimated the population size of P. clarkii across eight habitats where information on the number of individuals caught per trap was confirmed. A total of 1,859 individuals were captured across 295 traps during the 26 surveys conducted in the study area. The number of individuals captured per trap was 6.30. The highest number of individuals confirmed in a single trap was approximately 35, recorded on August 1, 2023. The second-highest number of individuals captured was 16.40, recorded on June 22, 2023, in the same wetland area (Table 4).
The total population size was estimated at approximately 327,987 individuals distributed across eight habitats, calculated by multiplying the density per unit area described in the research methods by the area available for habitation (Table 5). This suggests the possibility of a high density of P. clarkii in the area.
For the remaining 28 wetlands (17 classified as unconfirmed or moderate probability and above, as well as 11 confirmed wetlands lacking trap information), excluding the eight directly estimated habitats, the population size was estimated by applying the median (1.50), 25th percentile (0.85), and 75th percentile (4.02) of density estimates (individuals m-2) derived from trap catches using Eq. 2 to the available area of each wetland.
Table 6 indicates that the estimated population size for the 28 wetlands was approximately 490,500 individuals. When applying the 25th percentile, the estimate was approximately 277,900 individuals, and when applying the 75th percentile, it was approximately 1,314,500 individuals. Together with the previously estimated population size for the eight wetlands (approximately 7,700 individuals), the total population across the 36 wetlands in the study area was estimated to be approximately 818,500 individuals, with a percentile range from approximately 605,900 to 1,642,500 individuals.
Discussion
P. clarkii possesses ecological traits that enable it to adjust its reproductive strategy, spawning period, brood care, and sexual maturity according to environmental conditions, demonstrating a very high capacity for environmental adaptation (Alcorlo et al., 2008; Loureiro et al., 2015; Sommer, 1984). Since 2019, the Jeonbuk Regional Environmental Office has been capturing over 3,000 P. clarkii individuals in 2021 and over 10,000 in 2022. However, their population and range appear to be expanding. The complete eradication of invasive species may create ecological niches that favor new invasions by the same or different species. Consequently, population control is regarded as the optimal control strategy for areas invaded by P. clarkii until a more profound understanding of interactions within the invaded ecosystem is achieved (Loureiro et al., 2018).
The estimated population size and growth rate are significant indicators for determining which species should be prioritized for control, as they are related to range expansion and the severity of impacts (Parker et al., 1999; Pintor et al., 2009; Ricciardi, 2003). A greater abundance of invasive species implies increased resource use and interactions with native organisms. Monitoring the abundance of invasive species is therefore crucial for predicting impacts and developing control strategies (Ricciardi, 2007; Stohlgren & Schnase, 2006). Within a biogeographic region, population size is positively correlated with range size (Bock & Ricklefs, 1983; Gaston et al., 1997; Hanski, 1982), and the high abundance of invasive species has been identified as a risk factor for range expansion (Gaston et al., 1997).
Here, we propose an efficient control framework for P. clarkii under budgetary and personnel constraints by identifying potential habitats based on ecological characteristics and estimating population size using capture information. The RF-based habitat prediction model showed consistent performance (AUC=0.836) in repeated cross-validation, and was coupled with a trap-to-density conversion to estimate total abundance. Our results indicate that approximately 818,500 P. clarkii individuals (605,900-1,642,500) inhabit 36 gravel-and-sand bar wetlands and abandoned channel wetlands in the Yeongsangang River and Jiseokcheon Stream basins (median-based estimates).
Habitat size and the presence of permanent surface water emerged as pivotal factors, suggesting that, despite the high resilience of P. clarkii, stable habitat conditions remain a key constraint on establishment. Larger wetlands likely provide greater habitat continuity and refugia (e.g., complex channels and pools), which can buffer populations against local disturbances and increase persistence after partial removal. Permanent surface water may also facilitate overwintering and repeated reproduction by reducing mortality during dry periods and maintaining stable aquatic conditions. From a management perspective, control efforts should prioritize large wetlands with permanent surface water, where populations are more likely to persist and serve as sources for recolonization. Practical measures include intensive trapping/removal in high-suitability sites, repeated follow-up removal to prevent rapid rebound, and targeted surveillance (e.g., seasonal capture surveys or eDNA screening) to enable early detection and rapid response.
However, our estimates depend on the assumed capture radius (r) and capture probability (p), and uncertainty in these parameters may substantially affect inferred population size. Future studies should calibrate r and p through field experiments and quantify uncertainty using bootstrapping or sensitivity analyses. Cross-validation frameworks that account for spatial autocorrelation would further improve model generalizability and reliability.
From a control perspective, this study posits a three-stage control strategy predicated on estimated population size and habitat suitability. First, wetlands with high probability of occurrence, confirmed presence, and large habitat areas (Tier 1) require immediate removal and intensive control of the species. Second, wetlands with a high probability of occurrence but not yet confirmed (Tier 2) require early intervention, necessitating precise monitoring and pilot control experiments. Third, for wetlands with a moderate probability of habitation (Tier 3), low-cost monitoring systems should be established using eDNA analysis and seasonal capture surveys (Lee et al., 2025). For Tier-1 wetlands, the initial suppression target is set at approximately 10-20% annual population removal to impede further expansion. This target may necessitate adjustment in accordance with the prevailing site conditions, reproductive rates, and the probability of reinfestation. Therefore, the control target should be dynamically adjusted contingent on outcomes from future field-based capture probability and radius values, as well as sensitivity analysis results (Hein et al., 2007; Prior et al., 2018).
In conclusion, this study has provided a transferable framework for the quantitative assessment of invasive species populations by combining machine learning-based habitat suitability analysis with field capture data. The findings of this study will contribute to the understanding of the distribution and population dynamics of P. clarkii and serve as foundational data for establishing control priorities and developing effective control strategies. This approach can be applied not only in the context of South Korea but also to other regions experiencing problems with the spread of invasive crayfish, providing a useful reference case for international research on invasive species control.
Author Contributions
Conceptualization: YP, JP. Data curation: YP, SJE, Yunju C, SK. Funding acquisition: Youngho C. Writing – original draft: YP, JP, SK. Writing – review & editing: YP, JP, Youngho C.
Conflict of Interest
Youngho Cho is an editorial board member of the journal, but they were not involved in the review process of this manuscript. Otherwise, there is no conflict of interest to declare.
Funding
This study was supported by the National Institute of Ecology, funded by the Ministry of Climate, Energy, and Environment of the Republic of Korea (NIE-A-2026-12).
References
, , (2007) Intensive trapping and increased fish predation cause massive population decline of an invasive crayfish Freshwater Biology, 52, 1134-1146 https://doi.org/10.1111/j.1365-2427.2007.01741.x.
Figures and Tables
Fig. 1
The study area was delineated based on the spatial distribution of red swamp crayfish (Procambarus clarkii) capture sites.
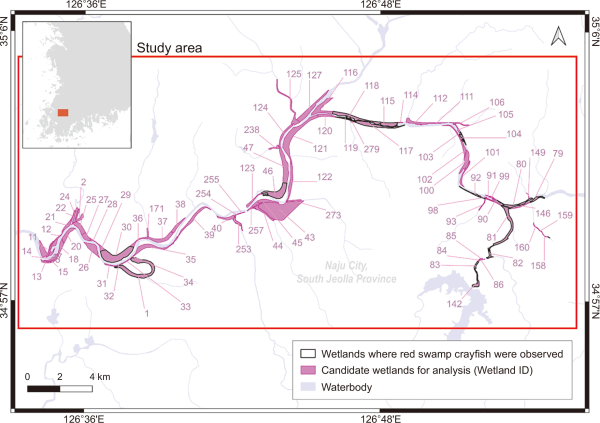
Fig. 2
Examples of unsuitable habitat areas. (A) Surfaces covered with concrete or pavement. (B) Compacted soil areas unsuitable for crayfish habitat.
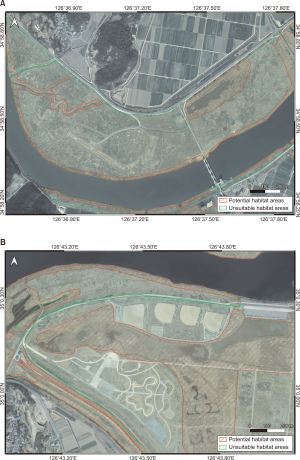
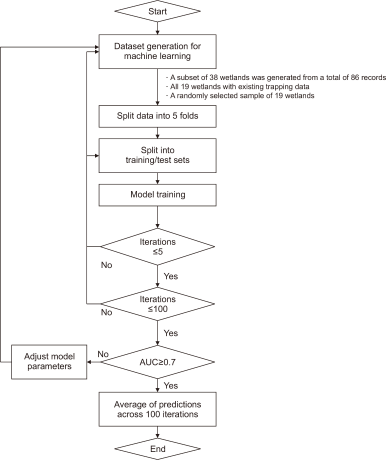
Fig. 4
Flowchart for estimating crayfish population based on habitat suitability and field survey data.
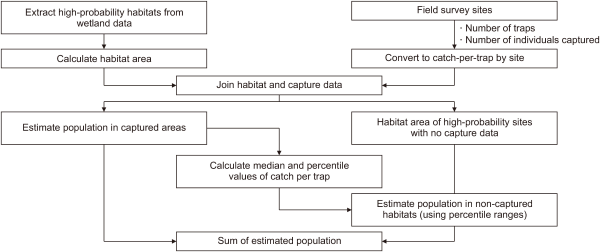
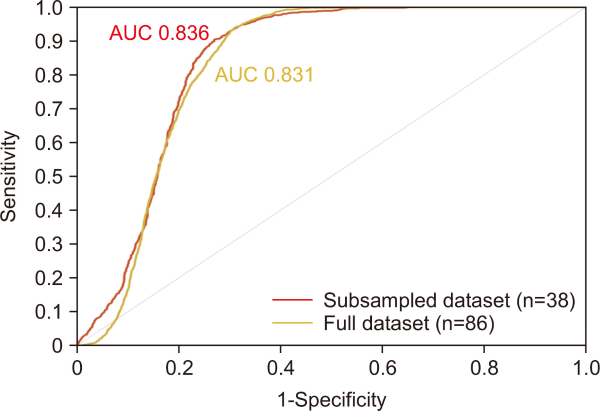
Fig. 6
Predicted probability of occurrence for Procambarus clarkii based on the Random Forest model. High probability wetlands or wetlands whose occurrence has been confirmed were the subject of population estimation.
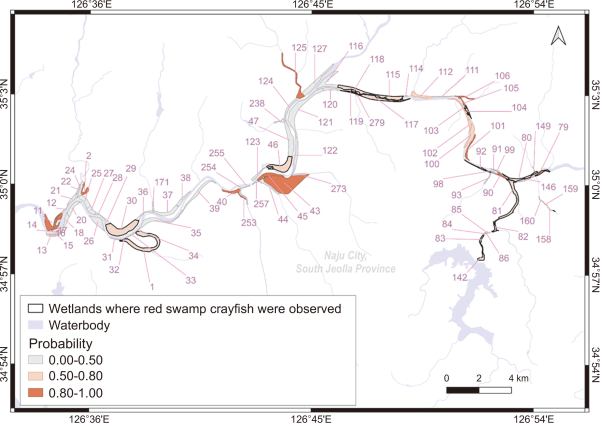
Table 1
Environmental information built on wetland data
| Class | Variable | Description | Data type |
|---|---|---|---|
| Site information | UID | • Wetland ID | Numeric |
| Wetland characteristics | type | • Topographical characteristics of the habitat | Categorical |
| 1: Old riverine wetland, 0: Sandbar wetland | |||
| area | • Total area of each wetland (ha) | Numeric | |
| avail_area | • Potential habitat area in each wetland (ha) | Numeric | |
| Land-cover | lc_bar | • Presence of sandbar | Categorical |
| 1: Yes, 0: No | |||
| lc_bare | • Presence of bare ground | Categorical | |
| 1: Yes, 0: No | |||
| Hydrological features | open_water | • Presence of open water | Categorical |
| 1: Yes, 0: No | |||
| lc_water | • Presence of perennial water flow | Categorical | |
| 1: Yes, 0: No | |||
| channel_pool | • Channels and pools within a wetland | Numeric | |
| 1: Sparse or absent, 2: Scattered, 3: Abundant | |||
| Ecological factors | food | • Expected abundance of food source | Categorical |
| 1: Abundant, 0: Low | |||
| predation_risk | • Accessibility for terrestrial predators | Categorical | |
| 1: Low, 2: Moderate, 3: High | |||
| Crayfish population | pop_trap | • Number of red swamp crayfish caught in traps | Numeric |
| pop_net | • Number of crayfish caught with a scoop net | Numeric | |
| trap | • Number of traps | Numeric | |
| pop_1trap | • Number of crayfish per trap | Numeric | |
| pop_total | • Total number of crayfish caught | Numeric | |
| obs | • Red swamp crayfish presence | Categorical | |
| 1: Observed, 0: Not observed |
Coding: food (0=low, 1=abundant); predation_risk (1=low, 2=moderate, 3=high), derived from consistent interpretation of aerial/satellite imagery and land-cover/topographic maps; predation_risk was based on judged proximity to roads and/or mountainous/forested areas. avail_area, area available for crayfish habitation; lc_bar, presence of gravel/sand bar; lc_bare, presence of bare ground; open_water, presence of open water surface; lc_water, presence of permanent water body; channel_pool, density of channels and pools; predation_risk, accessibility of terrestrial predators; pop_trap, number of individuals captured using traps; pop_net, number of individuals captured using a dip net; trap, number of traps deployed; pop_1trap, individuals captured per trap; pop_total, total number of individuals captured; obs, indicates red swamp crayfish presence.
Table 2
Variable importance based on Mean Decrease Gini
| Variable | Gini-based importance |
|---|---|
| channel_pool | 4.70 |
| avail_area | 2.85 |
| area | 2.68 |
| lc_water | 1.41 |
| water_flow | 0.44 |
| predation_risk | 0.46 |
| open_water | 0.44 |
| type | 0.13 |
| food | 0.04 |
| lc_bar | 0.00 |
| lc_bare | 0.00 |
channel_pool, density of channels and pools; avail_area, area available for crayfish habitation; lc_water, presence of permanent water body; water_flow, presence of water flow; predation_risk, accessibility of terrestrial predators; open_water, presence of open water surface; lc_bar, presence of gravel/sand bar; lc_bare, presence of bare ground.
Table 3
Comparison of observed occurrence and predicted habitat suitability probability
| Occurrence | Probability | Total | ||
|---|---|---|---|---|
|
|
||||
| High | Moderate | Low | ||
| Confirmed | 3 | 13 | 3 | 19 |
| Unconfirmed | 10 | 7 | 50 | 67 |
| Total | 13 | 20 | 53 | 86 |
Table 4
Results of a survey of red swamp crayfish populations in eight wetlands
| Wetland ID | Date | Population | Number of trap | Individuals per trap |
|---|---|---|---|---|
| 30 | 2023.06.22 | 82 | 5 | 16.40 |
| 2023.08.01 | 421 | 12 | 35.08 | |
| 2023.08.18 | 71 | 7 | 10.14 | |
| 2023.09.14 | 16 | 10 | 1.60 | |
| 2023.09.14 | 1 | 5 | 0.20 | |
| 46 | 2023.06.22 | 2 | 5 | 0.40 |
| 92 | 2023.02.21 | 0 | 1 | 0.00 |
| 2023.03.28 | 19 | 10 | 1.90 | |
| 2023.04.12 | 94 | 10 | 9.40 | |
| 2023.08.18 | 1 | 10 | 0.10 | |
| 2023.05.17 | 100 | 15 | 6.67 | |
| 2023.05.31 | 139 | 15 | 9.27 | |
| 2023.05.31 | 172 | 15 | 11.47 | |
| 2023.06.22 | 588 | 64 | 9.19 | |
| 98 | 2021.06.17 | 1 | 1 | 1.00 |
| 2021.07.05 | 6 | 1 | 6.00 | |
| 2021.09.06 | 1 | 1 | 1.00 | |
| 103 | 2023.08.01 | 16 | 10 | 1.60 |
| 111 | 2022.08.30 | 1 | 5 | 0.20 |
| 117 | 2023.08.01 | 2 | 2 | 1.00 |
| 142 | 2023.05.17 | 42 | 10 | 4.20 |
| 2023.04.12 | 21 | 15 | 1.40 | |
| 2023.05.31 | 2 | 15 | 0.13 | |
| 2023.05.25 | 30 | 15 | 2.00 | |
| 2023.03.28 | 11 | 16 | 0.69 | |
| 2023.08.01 | 20 | 20 | 1.00 | |
| Summary statistics (total/average) | 1,859 | 295 | 6.30 | |
Table 5
Estimated crayfish population by eight wetland
| Wetland ID | Area (ha) | Potential habitat area (ha) | Average individuals per trap | Estimated population |
|---|---|---|---|---|
| 30 | 91.7 | 22.0 | 15.2 | 251,044 |
| 46 | 57.4 | 6.2 | 0.4 | 1,862 |
| 92 | 6.4 | 6.2 | 8.0 | 37,236 |
| 98 | 0.7 | 0.7 | 2.7 | 1,419 |
| 103 | 10.4 | 3.3 | 1.6 | 3,964 |
| 111 | 4.3 | 4.3 | 0.2 | 646 |
| 117 | 37.3 | 30.9 | 1.0 | 23,198 |
| 142 | 10.8 | 8.2 | 1.4 | 8,618 |
| Total | 219.0 | 81.8 | 30.5 | 327,987 |
Table 6
Estimated population of Procambarus clarkii in the entire study area
| Wetland ID | Potential habitat area (ha) | Estimated red swamp crayfish population | Probability | ||
|---|---|---|---|---|---|
|
|
|||||
| 25th percentile | Median | 75th percentile | |||
| 2 | 11.0 | 7,266 | 12,823 | 34,364 | High |
| 11 | 17.9 | 11,824 | 20,866 | 55,920 | |
| 40 | 9.2 | 6,077 | 10,724 | 28,741 | |
| 43 | 70.2 | 46,371 | 81,831 | 219,307 | |
| 45 | 14.5 | 9,578 | 16,902 | 45,299 | |
| 90 | 5.9 | 3,897 | 6,878 | 18,432 | |
| 101 | 6.7 | 4,426 | 7,810 | 20,931 | |
| 105 | 4.6 | 3,039 | 5,362 | 14,371 | |
| 106 | 6.5 | 4,294 | 7,577 | 20,306 | |
| 125 | 23.2 | 15,325 | 27,044 | 72,478 | |
| 79* | 7.7 | 1,651 | 2,914 | 7,810 | |
| 14 | 2.5 | 10,899 | 19,234 | 51,547 | Moderate |
| 100 | 16.5 | 1,321 | 2,331 | 6,248 | |
| 102 | 2.0 | 8,653 | 15,270 | 40,925 | |
| 112 | 13.1 | 396 | 699 | 1,874 | |
| 158 | 0.6 | 462 | 816 | 2,187 | |
| 159 | 0.7 | 330 | 583 | 1,562 | |
| 279 | 0.5 | 5,086 | 8,976 | 24,055 | |
| 1* | 80.5 | 53,175 | 93,838 | 251,485 | |
| 80* | 15.2 | 10,040 | 17,718 | 47,485 | |
| 81* | 31.3 | 20,675 | 36,486 | 97,782 | |
| 82* | 5.6 | 3,699 | 6,528 | 17,495 | |
| 83* | 4.6 | 3,039 | 5,362 | 14,371 | |
| 104* | 6.5 | 4,294 | 7,577 | 20,306 | |
| 115* | 59.0 | 38,973 | 68,775 | 184,318 | |
| 118* | 2.3 | 1,519 | 2,681 | 7,185 | |
| 119* | 2.4 | 1,585 | 2,798 | 7,498 | |
| 157* | 0.1 | 66 | 117 | 312 | |
| Sum | 420.8 | 277,960 | 490,520 | 1,314,594 | |
| Population of Table 5 | 327,987 | ||||
| Total (①+②) | 605,947 | 818,507 | 1,642,581 | ||