open access
메뉴


*Background: The Hammersmith Functional Motor Scale-Expanded (HFMSE) is a clinical instrument used to evaluate motor function in the patients with spinal muscular atrophy (SMA). Conventional approaches, such as the manual muscle test (MMT), are often used to assess muscle strength. We propose a severity assessment technique for patients with SMA using the stimulated muscle contraction signal (SMCS), a quantitative technique to evaluate the severity of the disease by synthesizing functional motor assessment and muscle strength. The objective of the present study is to demonstrate the feasibility of the severity assessment technique using electrical stimulation signals. *Methods: A severity assessment index has been defined, including both functional motor assessment score and muscle strength. The methodology employed entails the acquisition of bio-signals related to the condition of the neuromuscular system, followed by a feature extraction procedure. The bio-signals are processed through this procedure, yielding an extracted feature vector that is subsequently fed into an artificial intelligence (AI) model. This ultimately results in the assessment of severity. In addition, since the index for severity encompasses both the functional motor assessment score and muscle strength, we also verified whether the AI model could estimate each index. *Results: The performance of the proposed technique was validated using a database consisting of 21 patients with SMA. The comparison between the model's estimated values and the labeled values based on a Pearson correlation showed a coefficient of 0.76. *Conclusion: The proposed technique was able to estimate the two indices, thereby demonstrating its capability to effectively estimate the defined severity index.
Spinal muscular atrophy (SMA) is a monogenic neurodegenerative disease that is autosomal recessively inherited. Its incidence is estimated to be approximately 1:6,000 to 1:10,000 in newborns [1]. SMA is the most prevalent motor neuron disease (MND) in children. Motor neuron diseases impede the transmission of electrical signals from motor neurons located within the spinal cord to motor nerves, consequently inducing accelerated motor nerve degeneration [2-5]. In clinical practice, physicians utilize functional motor assessments, such as the Hammersmith Functional Motor Scale-Expanded (HFMSE), to evaluate the severity of function and performance status in patients with SMA [6,7]. Additionally, the manual muscle test (MMT) is employed to assess muscle strength [8]. However, these methods entail subjective evaluation, which hinders the attainment of objective severity assessments [9,10].
Most patients diagnosed with SMA encounter challenges related to their mobility due to motor weakness. Consequently, these patients often face difficulties in maintaining frequent hospital visits for clinical evaluations and functional assessments. To overcome the limitations of mobility and subjective assessment methods, a technology has been proposed that uses wearable devices and artificial intelligence (AI) to assess the severity of neuro-logical disorders [11,12]. The impact of neurological disorders on the neuromuscular system emphasizes the need for the collection of physiological information. A key pathological feature of neuromuscular disease is the reduction in the cross-sectional area (CSA) of both myelin, which envelops motor neurons, and muscle fibers, ultimately leading to a decline in motor function [13-15]. Given the critical role of motor neurons and muscle fibers in movement, obtaining detailed information about these structures is essential for evaluating the severity of disease. The first step is to collect response signals that are triggered by electrical stimulation of the neuromuscular system. When a muscle is stimulated, the motor nerve and muscle fibers are activated, and surface electromyography (sEMG) records response signals from both the motor nerve and muscle fibers [16-20]. The previous studies have used compound muscle action potential (CMAP) signals to study muscle function evaluation [21-23]. To assess the severity of neuromuscular disease (NMD) based on the pattern of muscle response signals, long-term electromyography was recorded using electrical stimulation of various frequencies. These signals were defined as stimulated muscle contraction signals (SMCS) [24].
We propose an AI technique that estimates the defined index using SMCS, which includes bioinformation about the neuromuscular system. The aim of this study is to determine whether the SMCS can effectively reflect functional motor performance and muscle strength.
This study was conducted in accordance with the principles of the Declaration of Helsinki, and all patients provided written informed consent prior to enrollment. The study protocol was approved by the institutional review board (IRB No. 04-2022-034) of Pusan National University Yangsan Hospital. This cross-sectional study was conducted from March 2023 to December 2024. The inclusion criteria encompassed a genetic diagnosis of SMA. Exclusion criteria encompassed patients with (a) intellectual disabilities; and (b) neurological deficits other than SMA.
The Hammersmith Functional Motor Scale Expanded is a clinical assessment tool designed to evaluate motor function in individuals with SMA types 2 and 3, particularly those with higher functional abilities [25]. The final severity score is determined by aggregating the individual item scores. To complement the functional motor assessment, measurement of the maximum muscle strength of subjects at the ankle, knee, wrist, and elbow is necessary. The objective muscle strength was measured using a dedicated muscle strength assessment device (microFET2, HOGGAN, USA).
As disease progresses, different muscle groups experience varying degrees of weakness depending on the individual patient. This underscores the necessity for a multifaceted evaluation approach, incorporating diverse metrics to comprehensively assess SMA severity. To address this limitation, we performed an integrated approach that combines functional motor assessment scores with muscle strength values. Specifically, we defined the severity of NMD denoted as f, by constructing a feature vector that incorporates both functional assessment scores and strength measurements from multiple joints.
The formulation is as follows:
Where w, x, y, and z are muscle strength at ankle, muscle strength at knee, muscle strength at wrist, and muscle strength at elbow respectively. And hUL and hLL are results of functional motor assessment for upper limb and lower limb. At this time, since hUL and hLL have different maximum scores, the final out-come might be influenced by the scale difference. Therefore, we normalized using the maximum scores, as in equations (2) and (3), to obtain hUL,MAX and hLL,MAX. As w and x represent muscle strength for the lower limb, we defined hLL,MAX and lower limb muscle strength as a single vector. Similarly, since y and z represent muscle strength for upper limb, we defined hUL,MAX and upper limb muscle strength as a single vector.
Additionally, considering the inherent differences in muscle strength distribution between the upper and lower limbs, we performed standard deviation-based normalization within the collected database. Specifically, each muscle strength value was adjusted based on its deviation from the maximum, ensuring that differences in scale do not distort the severity evaluation. By applying these normalization techniques, we addressed the imbalance between functional motor assessment scores and muscle strength measurements, ensuring that the metric contribute equally to the severity evaluation. Finally, we defined a severity assessment index that integrates muscle strength across multiple joints and functional motor assessment results to provide a comprehensive measure of SMA severity.
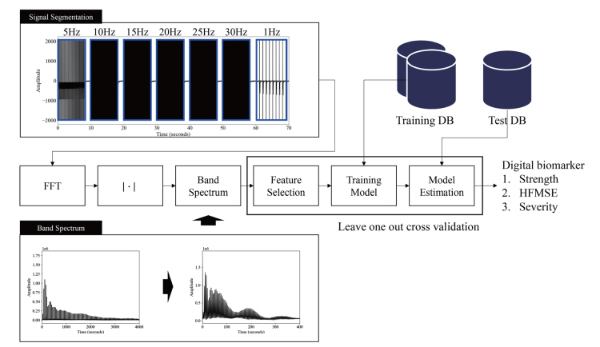
The proposed system is structured as illustrated in Fig. 1. The process commences with the collection of SMCS using a wearable device equipped with sEMG sensors. This device was designed to record muscle response signals while concurrently delivering electrical stimulation to the target muscles. The stimulation was initiated at an initial frequency of 5 Hz, with data being recorded for a period of 8 seconds. Thereafter, the stimulation frequency was progressively augmented in 5 Hz increments, reaching up to 30 Hz.
The collected SMCS data was then segmented according to the applied stimulation frequencies. From these segmented signals, feature vectors were extracted using frequency-specific feature extraction techniques. Spectrum analysis through the Fast Fourier Transform (FFT) was employed to derive meaningful features from the SMCS, which serve as inputs for an AI model. To effectively interpret the frequency characteristics of the data, an artificial neural network (ANN) was utilized for model training and analysis.
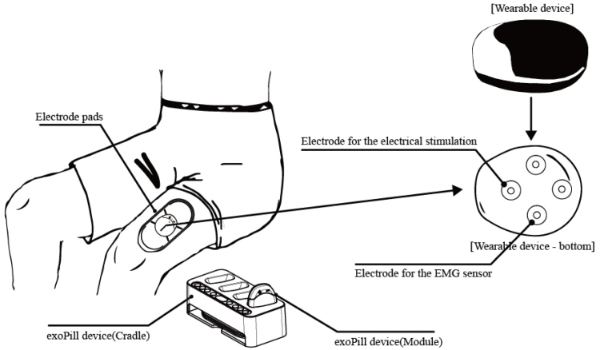
As shown in Fig. 2, the wearable device (exoPill, EXOSYS-TEMS Inc., Korea) is an integrated electrostimulator and sEMG sensor with four exposed electrodes on the underside. These electrodes interface with hydrogel pads and magnets, ensuring a secure connection between the device and skin on the target muscle. The following six body parts were used for the collection of SMCS with the exoPill attachment: the anterior arm (lower flexors), the anterior forearm (wrist flexors), the anterior thigh (knee extensors), the anterior lower leg (ankle extensors), the posterior thigh (knee flexors), and the posterior lower leg (ankle flexors). exoPill is wirelessly connected to a smartphone application, which provided guidance during the data acquisition process. The SMCS data, recorded in accordance with the application’s instructions, was automatically transmitted and stored on a central server.
Since the signals were recorded under electrical stimulation at various frequencies from 5 Hz to 30 Hz, each segment exhibited unique frequency characteristics. Therefore, the segmented signals were analyzed individually to account for these fluctuations before feature extraction. Features with an absolute correlation coefficient greater than 0.25 were selected as the AI input vector. Leave-One-Out Cross-Validation (LOOCV) was performed, and feature selection was performed on the training data set before model training to optimize the feature representation.
The training procedure for the ANN regression model consisted of two major stages. First, the model parameters were initialized to ensure a stable starting point for learning. This initialization was performed using a uniform distribution centered around zero [26]. Next, the model underwent fine-tuning through backpropagation, which iteratively updates the weight matrices and bias vectors to optimize performance [27]. During this process, we utilized the logistic activation function to enhance learning stability and employ mean squared error (MSE) as the loss function to measure estimation accuracy.
The ANN architecture consists of two hidden layers with (16, 16) units, respectively. To prevent overfitting, a L2 regularization was applied during training, ensuring model generalization. Finally, the ANN model was trained to estimate digital biomarkers for severity of SMA, leveraging the extracted feature vectors to provide meaningful insights.
A total of 21 patients with SMA participated in this study. Of these, 14 were diagnosed as type 2, while the remaining seven were diagnosed with type 3. The mean age was 26.1 with 14.4 standard deviation. The mean of height and body weight were 151.6 cm with 14.8 cm standard deviation and 42.8 kg with 17.4 kg standard deviation, respectively. And the mean of HFMSE score was 21.3 with 19.8 standard deviation.
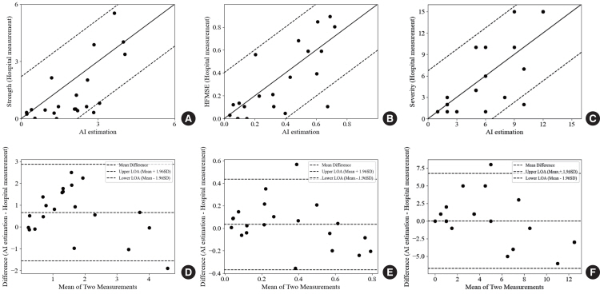
In the scatter plots shown in Fig. 3A, B, and C, the x-axis represents the model estimations and the y-axis represents the actual value, and a significant correlation was observed between the estimate and the actual value. The ANN models trained to estimate the functional motor assessment index and muscle strength index individually exhibited reasonable predictive performance. The quantitative evaluation results for the trained model are summarized in Table 1. The correlation coefficient was 0.76, and the standard deviation of errors for the severity digital biomarker was 3.35.
In the Bland-Altman plots shown in Fig. 3D, E, and F, the observed errors appear to be distributed uniformly across the entire range, thereby suggesting a low degree of bias in the trained model. Therefore, the analysis of the Bland-Altman plot suggests that the proposed AI model was trained in a balanced manner without bias. Furthermore, the model designed to estimate the severity digital biomarker, which integrates both indices, also yielded highly significant results, supporting the validity of the proposed approach.
| Functional motor index | Muscle strength | Digital biomarker for severity | |||||||||
|---|---|---|---|---|---|---|---|---|---|---|---|
| ME | STDE | r | P-value | ME | STDE | r | P-value | ME | STDE | r | P-value |
| 0.03 | 0.20 | 0.74 | <0.001 | 0.66 | 1.10 | 0.70 | <0.001 | 0.00 | 3.35 | 0.76 | <0.001 |
$p$-value for Pearson correlation coefficient. ME, mean error; STDE, standard deviation of error.
This study demonstrates the feasibility of an AI-based technology using SMCS to assess the severity of SMA. The severity index comprises two clinical measures: muscle strength and functional motor assessment score. Therefore, the efficacy of the proposed method in estimating the severity index should also represent the ability to estimate each individual component. To validate this hypothesis, we trained AI models to predict both muscle strength and functional motor assessment score using SMCS data as the input. The experimental results demonstrated statistically significant correlations between the model estimates and the clinical measurements, MMT and HFMSE. These findings suggest that SMCS contains relevant information related to muscle strength and functional motor performance, demonstrating the potential of the proposed method for quantitative assessment of neuromuscular function.
Several studies have investigated the correlation between features derived from CMAP signals collected from SMA patients and functional assessment. When the features extracted from the CMAP signals were compared with muscle strength and HFMSE, a strong correlation ranging from 0.73 to 0.79 was found [28,29]. These findings imply a close relationship between the neuromuscular bio-signal CMAP and muscle motor function. Since SMCS signals are measured using a similar principle to CMAP, it is confirmed that SMCS can be used to assess muscle strength and functional score such as HFMSE.
Increasing the frequency of electrical stimulation in SMCS resulted in a decrease in the duration of the observable response signal between stimulation pulses. At 35 Hz, the response signal was barely distinguishable due to overlapping stimulation artifacts. Therefore, in this study, stimulation frequencies were limited to a maximum of 30 Hz. Although this study limited the electrical stimulation frequency to 30 Hz or below, it is possible that important information related to neuromuscular responses exists in higher-frequency stimulation above 30 Hz. Although a range of stimulation frequencies was explored in previous studies [30,31], the parameters used therein may not be fully optimized for the proposed system. To further enhance the performance and reliability of the proposed technique, future studies are needed to determine the optimal stimulation frequency.
There are several limitations in this study. First, SMCS in the proximal joints such as shoulder or pelvic girdle muscles were not included. Because proximal joints have a high degree of freedom and many involved muscles, it is difficult in measuring and analyzing signals in one direction with various muscles. Muscle strength of proximal joints plays a crucial role in performing functional movements in activities of daily livings. Therefore, future study should include proximal muscle strength to better represent the relationship between functional assessment and muscle strength. Second, the HFMSE was used in the assessment of motor function; however, it primarily reflects gross motor abilities and does not capture upper extremity fine motor function. Including an evaluation of upper extremity function, along with both gross and fine motor skills, would provide a more thorough representation of actual functional capabilities.
As of March 2025, SMA treatments have advanced significantly with the FDA-approved three disease-modifying treatments: antisense oligonucleotide nusinersen, gene replacement therapy onasemnogen abeparvovec, and small molecule splicing modifier risdiplam [32]. These treatments target the survival motor neuron protein deficiency, which results in an extended life span and improved quality of life for people with SMA. Given that these innovative treatments can have a life-long impact, there is a need for a way to detect and manage the disease characteristics associated with the treatment. We expect that AI-based technologies that use SMCS to assess the severity of SMA will be further developed and become one of the options to objectively measure the functional status of individuals with SMA.
The present AI-based system, utilizing SMCS, has been developed for the purpose of evaluating the severity of SMA. SMA directly impacts the neuromuscular system. Consequently, it is imperative to obtain neuromuscular information for an accurate assessment of the severity of the disease. The SMCS data demonstrated a strong correlation between the AI model estimates and the clinical assessment data, indicating the model’s potential for reliable disease severity assessment. The present AI-based system has the advantage of enabling severity assessment with improved accessibility and convenience. This is particularly advantageous for individuals with limited mobility due to SMA.
Piasecki M, Ireland A, Coulson J, Stashuk DW, Hamilton-Wright A, Swiecicka A, et al. Motor unit number estimates and neuromuscular transmission in the tibialis anterior of master athletes: evidence that athletic older people are not spared from age-related motor unit remodeling. Physiol Rep 2016;4(19):e12987. doi: 10.14814/phy2.12987.