Introduction
Aculamprotula coreana (Bivalvia: Unionoida), a freshwater bivalvia species endemic to the Korean Peninsula, inhabits the bottom of streams and lakes and is an important species that contributes to water purification and ecosystem health through filter feeding (Chun, 1969). It has been utilized as a pearl seed (a key structure for pearl production) in the past and has played an important economic and industrial role in the domestic pearl farming industry (Chun, 1969; Ko, 2018). However, with the decline of the domestic pearl farming industry after the mid-20th century, a result of declining competitiveness and reduced economic viability, systematic management and research on A. coreana gradually diminished (Kim et al., 2015). This has led to insufficient efforts to protect and enhance natural habitats, resulting in a considerable decrease in habitat size due to river development, water pollution, and the construction of artificial dams and weirs that have reduced river flows and altered sediment characteristics (Kim et al., 2019). Due to these causes, A. coreana population has declined substantially and is protected by the government as a Class I endangered wildlife species (National Institute of Ecology, 2025).
A. coreana primarily inhabits mixed gravel and sand substrates in streams and lakes (National Institute of Ecology, 2025), with high densities in areas of moderate flow (Kim et al., 2015). Adult individuals live in sediment layers, where they function as filter feeders, filtering water to consume plankton and organic matter. They possess a distinctive reproductive strategy that includes a larval stage (glochidium), which parasitizes the gills of specific fish species (Choi & Choi, 1965; Choi et al., 1968). These characteristics render A. coreana a highly vulnerable species to environmental change and habitat disturbance (National Institute of Ecology, 2025).
Recent studies have analyzed the correlation between habitat quality and population density (Kim et al., 2015) and evaluated the effects of sediment physico-chemical properties on the survival and growth rates of A. coreana (Kim et al., 2019). However, there is a paucity of research on the acquisition of alternative habitats and the restoration of viable areas to counteract the loss of existing habitats.
This study aimed to analyze the habitat characteristics based on the occurrence data of A. coreana collected from Korean rivers and lakes, and to identify potential habitats using the MaxEnt model. The findings of this study are expected to provide a scientific foundation for developing restoration strategies, such as the creation of alternative habitats for A. coreana.
Materials and Methods
Study area and occurrence date collection
In this study, a total of 21 locations were identified based on data collected from human observations, illustrated guides, and literature between 1975 and 2022 to analyze the potential habitat of A. coreana. In particular, the data of 12 locations identified from 2014 to 2022 were collected with the approval of the Jeonbuk Regional Environmental Management Office (permit no. 2022-18; Fig. 1, Appendix 1).
Environmental variables and date processing
For physical environmental variables, the stream order classification scheme proposed by Stahler (1952) was applied using a digital elevation model constructed by extracting contour layers from a 1:25,000-scale topographic map to distinguish habitat types and sizes. Furthermore, chemical and physical environmental variables were measured from 2018 to 2022 at 11 water quality stations adjacent to sites where A. coreana was observed (NIBR, 2025). Correlations between habitat and water quality factors were analyzed using the R software (version 4.2.2; R Foundation, 2022).
To predict potential habitats, the MaxEnt program (Philips et al., 2006) was used with temperature- and precipitation-based CMIP6 model (HadGEM3-GC31-LL) data provided by WorldClim (2025) (Hijmans et al., 2005). A. coreana is a species with a highly circumscribed geographic distribution. To assess the impact of bioclimatic variables on habitat distribution, 19 biologically meaningful bioclimatic variables were included in the analysis at a 1 km2 resolution (Table 1).
MaxEnt model analysis
Long-term observations (21 sites) from 1976 to 2022 were utilized to ascertain the historical distribution range and long-term habitat change of A. coreana. Recent observations (12 sites) from 2014 to 2022 were separately analyzed to estimate the actual habitat availability based on current environmental conditions.
The MaxEnt model (ver. 3.4.4) was employed to analyze the potential habitat analysis for A. coreana. This model utilizes the maximum entropy approach to model the relationship between environmental variables based on the location data of species occurrence points. The model has been demonstrated to be effective in predicting the distribution of rare species, including endangered species, due to its ability to make accurate predictions with a relatively small amount of data (Hernandez et al., 2006; Phillips & Dudík, 2008). The default values of the MaxEnt program were utilized, and to evaluate the predictive accuracy of the model, the model was run 10 times by bootstrapping method, in which 75% and 25% of the A. coreana location data assigned to training and validation data, respectively. The raw value, which is the initial prediction resulting from running the MaxEnt model, represents the exponential function of the likelihood of finding A. coreana at point “x” where it has been identified. Since these values were not in the form of probabilities and were difficult to interpret, the potential distribution areas of A. coreana were evaluated using the results of a complementary log-log (cloglog) transformation to have probability of occurrence values between 0 and 1 (Phillips & Dudík, 2008; Phillips et al., 2017). The probability of potential distribution is given as a probability from 0 to 1, with a value closer to 1 indicating distribution or a high probability of occurrence (Hanley & McNeil, 1982; Phillips & Dudík, 2008).
The evaluation of the variables affecting the potential distribution of A. coreana was conducted using percent contribution and permutation importance provided by the model results. The percent contribution is a metric that quantifies the impact of each environmental variable on the prediction of the model. The relative contribution of each environmental variable was determined by modifying the gain value, which represents the relative weight of each variable, during the training process of the model to derive the optimal model result. The percent contribution of all environment variables add up to 100%. The permutation importance was determined by the change in the predictive accuracy of the model when the original and randomized A. coreana location data were used as the environmental variables. The permutation importance of an environmental variable is higher as the accuracy decreases or increases; if there is no change in the predictive accuracy of the model, the environmental variable is considered less important (Phillips & Dudík, 2008).
The potential distribution areas of A. coreana were mapped using the QGIS software (QGIS, 2023), along with the calculated ranges and areas of environmental variables.
Results and Discussion
Distribution and habitat characteristics
A. coreana is endemic to the Korean Peninsula and is currently protected by the Ministry of Environment as a Class I endangered wildlife species. It is classified as “Critically Endangered” in the Korean Red List of Threatened Species (NIBR, 2022). Previous studies have reported that A. coreana was widely distributed in major rivers in Korea, including the Daedong River, Han River, Nakdong River, Geum River, Yeongsan River, and Seomjin River (Je & Noh, 1987; Kil, 1976). However, since 2010, the species has been found only in a few locations in the Geum River and Seomjin River, suggesting a considerable reduction in its distribution range.
Analysis of stream order across all observation sites revealed a trend toward occurrence in medium-sized stream segments of orders 6-8 and above, with an average order of 7.0 (±1.2; Appendix 1), suggesting that A. coreana preferred stream environments with a certain level of stability in terms of velocity, depth, and flow (Kim et al., 2015). The habitat is distinguished by an average elevation of 163.9 m (range: 102.0-271.0 m), exhibiting a predominant distribution in the middle and lower reaches at relatively low elevations.
The average values from 2018 to 2022 for the 10 commonly measured items in the water quality measurement network at 11 sites were: biological oxygen demand (BOD) 0.55-1.17 mg/L, chemical oxygen demand (COD) 3.4-4.1 mg/L, dissolved oxygen 10.4-11.1 mg/L, electrical conductivity (EC) 106.8-176.2 μS/cm, pH 7.5-8.4, suspended solids (SS) 2.2-6.6 mg/L, water temperature (W-T) 14.1-16.0°C, total nitrogen (T-N) 1.050-2.049 mg/L, total organic carbon (TOC) 2.082-2.358 mg/L, and total phosphorus 0.010-0.032 mg/L (Appendix 2). In addition, BOD and T-N, COD and TOC, EC and T-N, BOD and EC, BOD and SS, EC and SS, and SS and T-N showed positive correlations of 0.6 or greater (P<0.05; Fig. 2). As a filter-feeding bivalve, A. coreana exhibits physiological characteristics that render it sensitive to elevated turbidity and SS concentrations in the water column, indicating that the physico-chemical conditions of its habitat play an important role in its survival. Specifically, the substantial correlations with turbidity-related water quality factors, including BOD, SS, EC, and T-N, substantiate the hypothesis that the habitat of A. coreana is profoundly influenced by these environmental factors. Consequently, environmental changes, such as elevated turbidity or organic particles, can act as crucial ecological limiting factors, potentially inducing physiological stress or elevating mortality rates within this species.
Such ecological sensitivity has been confirmed in past transplantation cases. In one case, where individuals collected from the Han River were relocated to the Milyang River and Nakdong River mainstem, most of the individuals died in the Nakdong River mainstem due to high turbidity and deposition of mud in the gills (Chun, 1969), indicating that this species requires a relatively clean and stable water environment. Therefore, the conservation of A. coreana necessitates a meticulous environmental assessment and management of its habitats, prioritizing the water quality conditions essential for its survival rather than merely relocating individuals or expanding habitats (NIBR, 2022).
Prediction and validation of potential habitats
For the analysis of the historical distribution range and long-term habitat changes of A. coreana, long-term observation data from 1975 to 2022 (21 sites in total) were used. In addition, recent observation data from 2014 to 2022 (12 sites in total) were used for comparative analysis using the MaxEnt model to more accurately estimate the habitable area, reflecting current environmental conditions.
In the prediction model based on long-term observations, the average temperature of the coldest month (BIO11) was identified as a key variable with a percent contribution of 47.2%; however, the variable permutation importance was 0%, indicating that it did not substantially affect the predictive accuracy. On the other contrary, the average temperature of the warmest period (BIO08) exhibited a comparatively modest percent contribution of 16.4%, yet its permutation importance reached a notable 47.5%, underscoring its substantial impact on the sensitivity and precision of the prediction. While this finding suggests that A. coreana may have previously exhibited a physiological response to winter W-T, it also suggests that current habitat predictions recognize the greater influence of warmer summer conditions. Models employing recent observations also demonstrated that BIO08 had the highest values for both percent contribution (57.0%) and permutation importance (50.7%), indicating that average summer temperatures are a decisive variable in the current distribution of the species. Recent data exhibit smaller sample sizes and spatial biases, which can be interpreted as indications that the model exhibits heightened sensitivity to specific variables. In addition to W-T, rainfall appeared to have some influence on the distribution of A. coreana, as the wettest month (BIO13) had a relatively high percent contribution in both models (Table 2).
In both models, temperature-related variables were identified as pivotal predictors, with BIO08 consistently emerging as the most significant variable in predicting the distribution of A. coreana. This finding indicates that A. coreana exhibits physiological characteristics that are susceptible to the average summer W-T. Consequently, fluctuations in this variable under climate change scenarios are anticipated to exert both direct and indirect influences on the distribution of the species.
The potential habitat for A. coreana predicted using the MaxEnt model was expressed as a probability value ranging from 0 to 1, with values closer to 1 indicating a higher probability of occurrence. The predictions indicate that the spatial extent of the habitable zone along the west and south coasts is greater in models based on recent observations than in models based on older observations (Fig. 3). These findings suggest that recent increases in average summer W-T (BIO08) may have expanded the areas that meet the physical conditions for A. coreana to survive. Indeed, Liu et al. (2020) report that river W-T have increased by approximately 0.5°C over the past decade, providing a climatological basis for this spatial shift.
However, this expansion of habitable areas does not inherently imply that populations will invariably disperse. It is imperative that this expansion be accompanied by field-based validation studies to ascertain that the areas predicted by the model to have a high probability of supporting the survival and reproduction of the species are indeed capable of doing so. In particular, A. coreana is an endangered wildlife species, characterized by its limited population size and distribution. Its elusiveness is attributable to its predominant distribution in deep water habitats. In fact, there are numerous areas in which the species has been observed in the past, yet no individuals have been detected in the last decade. This finding has led to a considerable level of uncertainty regarding its current distribution. Notably, models based solely on recent data are also likely to suffer from overfitting due to small sample sizes and spatial bias, suggesting that the model may over-adapt to specific environmental conditions and not reflect the true distribution. Therefore, field surveys and monitoring should be prioritized in areas where high probability of occurrence has been predicted. Moreover, a precise understanding of the relationship between the ecological requirements of species and local environmental variables will be essential to improve the effectiveness of future conservation strategies.
The predictive performance of the MaxEnt model is evaluated based on its area under the curve (AUC) value, which is generally considered significant if it reaches an AUC value of 0.7 or higher (Phillips & Dudík, 2008). The habitat prediction model for A. coreana developed in this study showed very high predictive power with an AUC value of 0.949 (±0.013) based on long-term observations, and the model based on recent observations also showed high reliability with an AUC value of 0.910 (±0.029). In particular, the high predictive accuracy of models based on long-term data may have been attributed to the use of emergence data covering a wide range of time periods and environmental conditions. Since the model based on recent data also has an AUC value of more than 0.9, it is considered to have high practical applicability for current and future conservation management strategies.
In conclusion, the distribution of A. coreana is currently localized and its habitat characteristics are restricted to clean, stable water environments in medium-sized and larger streams. Subsequent systematic follow-up studies, incorporating meticulous field monitoring, extensive long-term ecological research, and targeted habitat restoration, are essential to ascertain the viability of habitats predicted using the MaxEnt model. These efforts should be integrated into pragmatic and scientifically informed conservation policies to enhance the effectiveness of species conservation efforts.
Author Contributions
Conceptualization: SJK, YP. Data curation: SJK, SPH, YCJ, YLJ. Formal analysis: SJK, HGK. Funding acquisition: YLJ. Writing – review & editing: SJK, HGK, YP.
Funding
This work was supported by a grant from the 6th National Ecosystem Survey of National Institute of Ecology (NIE), funded by the Ministry of Environment of the Republic of Korea (NIE-A-2025-01).
Figures and Tables
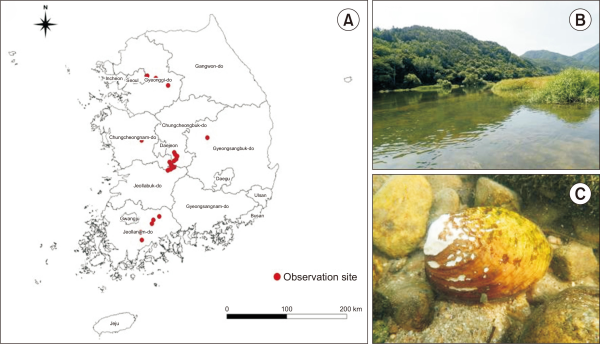
Fig. 2
The habitats of Aculamprotula coreana correlation analysis with chemical factors. Corr, correlation; BOD, biological oxygen demand; COD, chemical oxygen demand; DO, dissolved oxygen; EC, electrical conductivity; SS, suspended solids; W.T, water temperature; T.N, total nitrogen; TOC, total organic carbon; T.P, total phosphorus. *P<0.05, **P<0.01, ***P<0.001.
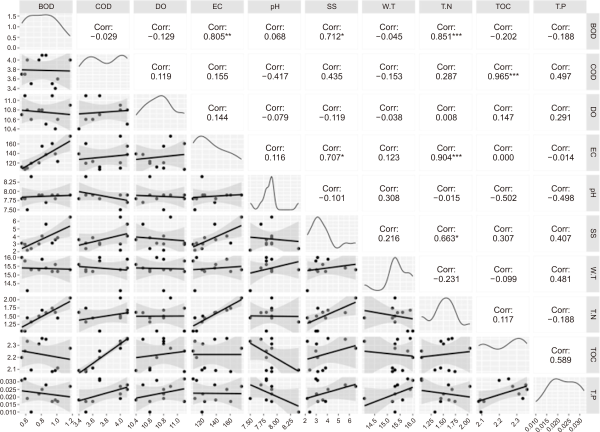
Fig. 3
The predicted potential distribution maps of Aculamprotula coreana in (A) 1976-2022 (n=21) and (B) 2010-2022 (n=12).
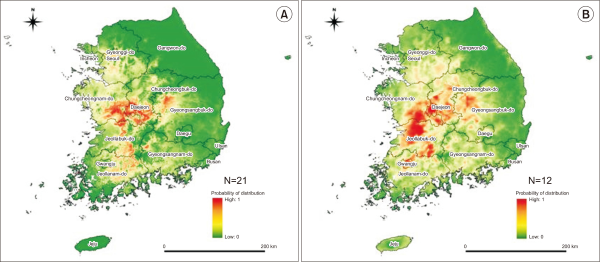
Table 1
List of bioclimatic variables
| Bioclimatic variable | Units | |
|---|---|---|
| BIO01 | Annual mean temperature | °C |
| BIO02 | Mean diurnal range (mean of monthly (max temp–min temp)) | °C |
| BIO03 | Isothermality(BIO02/BIO07) (*100) | % |
| BIO04 | Temperature seasonality (standard deviation*100) | % |
| BIO05 | Max temperature of warmest month | °C |
| BIO06 | Min temperature of coldest month | °C |
| BIO07 | Temperature annual range (BIO05-BIO06) | °C |
| BIO08 | Mean temperature of wettest quarter | °C |
| BIO09 | Mean temperature of driest quarter | °C |
| BIO10 | Mean temperature of warmest quarter | °C |
| BIO11 | Mean temperature of coldest quarter | °C |
| BIO12 | Annual precipitation | mm |
| BIO13 | Precipitation of wettest month | mm |
| BIO14 | Precipitation of driest month | mm |
| BIO15 | Precipitation seasonality (coefficient of variation) | % |
| BIO16 | Precipitation of wettest quarter | mm |
| BIO17 | Precipitation of driest quarter | mm |
| BIO18 | Precipitation of warmest quarter | mm |
| BIO19 | Precipitation of coldest quarter | mm |
Table 2
Bioclimate variables and their relative percent contribution and permutation importance in the MaxEnt model
| Long-term observation (n=21) | Recent observation (n=21) | |||||
|---|---|---|---|---|---|---|
|
|
|
|||||
| Variable | Percent contribution (%) | Permutation importance (%) | Variable | Percent contribution (%) | Permutation importance (%) | |
| BIO11 | 47.2 | 0.0 | BIO08 | 57.0 | 50.7 | |
| BIO08 | 16.4 | 47.5 | BIO13 | 19.0 | 23.8 | |
| BIO13 | 8.2 | 12.8 | BIO03 | 8.9 | 4.8 | |
| BIO14 | 6.6 | 8.6 | BIO02 | 8.4 | 0.0 | |
| BIO10 | 6.1 | 11.5 | BIO14 | 1.5 | 1.1 | |
| BIO09 | 5.4 | 10.4 | BIO04 | 1.4 | 0.0 | |
| BIO18 | 4.3 | 2.3 | BIO09 | 1.1 | 0.6 | |
| BIO03 | 1.9 | 0.8 | BIO10 | 0.9 | 2.0 | |
| BIO04 | 1.3 | 1.4 | BIO17 | 0.7 | 6.2 | |
| BIO02 | 0.8 | 0.1 | BIO05 | 0.6 | 4.1 | |
| BIO12 | 0.7 | 1.9 | BIO12 | 0.3 | 2.0 | |
| BIO05 | 0.6 | 1.0 | BIO16 | 0.1 | 1.8 | |
| BIO15 | 0.3 | 1.2 | BIO11 | 0.1 | 1.3 | |
| BIO07 | 0.1 | 0.0 | BIO18 | 0.1 | 0.9 | |
| BIO17 | 0.0 | 0.3 | BIO07 | 0.0 | 0.5 | |
| BIO19 | 0.0 | 0.0 | BIO19 | 0.0 | 0.0 | |
| BIO16 | 0.0 | 0.0 | BIO01 | 0.0 | 0.0 | |
| BIO06 | 0.0 | 0.0 | BIO15 | 0.0 | 0.0 | |
| BIO01 | 0.0 | 0.0 | BIO06 | 0.0 | 0.0 | |