Introduction
When a country is in the development stage, environmental regulations are weak or nonexistent, and pollution-intensive industries grow rapidly. As a country’s income rises to the middle level, demands for environmental policy formulation and environmental protection begin to emerge to some extent (Dasgupta et al., 2001). Since the 1960s, South Korea has focused on fostering industries, such as oil refining, fertilizers, and integrated steelworks, to build a national industrial base and develop underdeveloped areas (Ryu et al., 2018). By concentrating on development with the goals of rationality and efficiency, the country succeeded in entering the ranks of advanced nations, but various problems arose because of indiscriminate development (Kim et al., 2014).
Ecological issues can be defined as phenomena that occur widely on Earth, such as pollution, resource depletion, population growth, and destruction of wildlife and habitats caused by human actions (Koo, 2004). Human, industrial, and other activities inevitably impact the environment and sometimes cause environmental damage (Bergkamp, 2001). Science, as a means to address these problems, identifies environmental status, and policymakers can use the results to propose positivist policies. However, owing to the inherent complexity of science, it is difficult for the general public to understand (Keeley & Scoones, 1999). Therefore, to assist users and policymakers, it is necessary to present simple algorithms and analytical models that ensure the availability of digital data, the simplicity and feasibility of the planning process, and transparency in discussions during future utilization stages (Larondelle & Haase, 2012). Various environmental maps have been created and utilized for policy decision-making. Representative examples include Japan’s Natural Vegetation Map, Germany’s Biotope Map, and Austria’s hemeroby index. Japan’s Natural Vegetation Natural Map evaluates the vegetation in five stages. Germany’s Biotope Map is assessed in five stages, including individual, spatial, and correlational factors. Austria’s hemeroby index is divided into nine stages and used for policy purposes.
In South Korea, Article 34 of the Natural Environment Conservation Act stipulates the preparation and utilization of the Ecological and Natural Map (ENM) and Article 34-2 that of the Urban Ecological Map (UEM) to be used in the establishment or implementation of land use and development plans (Korea Legislation Research Institute, 2024). The ENM is created with Grades 1, 2, and 3 based on the ecological value, naturalness, and landscape value of natural environments such as mountains, rivers, inland wetlands, lakes, farmland, and cities, making it easy for anyone to understand. The UEM, as a supplementary provision of the same article, refers to a ‘detailed ENM’ created with Grades 1 to 5 for municipalities at the level of cities or above (Korea Legislation Research Institute, 2024). The ENM was legislated in 1998, with preparation guidelines first established as administrative rules in 2000 and the initial announcement of 794 map sheets at a 1:25,000 scale in 2007. It was later expanded to 800 map sheets, and the nationwide ENM was updated in three phases (NIE, 2024). The UEM was legislated in 2018, making preparation mandatory for 84 municipalities at the level of cities or above, with 83 municipalities having completed preparation by 2025.
These maps provide environmental spatial information based on the same law and share various commonalities; however, there are clear differences in the preparation systems, purposes, application areas, and policy linkages (Hwang et al., 2022). However, because maps have similar preparation purposes and provide spatial information of ecosystems, they are often perceived as the same map.
Therefore, the purpose of this study was to compare and analyze the similarities and differences between the two maps, which are important tools in environmental policy, and to suggest improvements. Furthermore, it aimed to enhance the utilization of both maps and strengthen the efficiency of the system to enhance their importance in national environmental policies.
Materials and Methods
This study analyzed the ENM and UEM, which are used as key basic data in South Korea’s environmental policies (Fig. 1). Using content analysis, a comparative examination of the definitions, legal foundations, responsible institutions, scope of preparation, and utilization strategies of ENM and UEM was conducted through a direct analysis of the relevant provisions within the applicable legal frameworks. In addition, a comparative analysis of the administrative regulations governing ENM and UEM was conducted to examine the specific methodologies used in their preparation and the foundational data used in the process. The laws and guidelines used in the analysis were the currently enforced Natural Environment Conservation Act (Act No. 20231, effective 2025.8.7.), Ministry of Environment Directive No. 753 (2024.9.11) “Guidelines for Preparing the ENM,” and Ministry of Environment Notification No. 2024-251 (2024.12.5) “Guidelines for Preparing the UEM” (Korea Law Information Center, 2024a; 2024b; Korea Legislation Research Institute, 2024) (Table 1).
Results
As described above, the purpose of preparing the ENM and the UEM was the same, but there are differences in their utilization methods and scope of application. This section comparatively analyzes the differences between the two maps (Table 2).
The first difference relates to the preparation method. The ENM was prepared by the central government (Ministry of Environment), based on the results of natural environment and detailed ecosystem surveys conducted in accordance with Articles 30 and 31 of the Natural Environment Conservation Act (Korea Legislation Research Institute, 2024). The surveys covered vegetation, flora, birds, insects, mammals, amphibians, reptiles, large benthic invertebrates, freshwater fish, and terrain. The structure of the map is similar to that of a nationwide natural environment survey. The nationwide natural environment survey divided the entire national territory into 824 map sheets based on a 1:25,000 scale topographic map. The entire territory is divided into three large regions, which are further subdivided into five medium-sized regions one of which is surveyed each year, completing a nationwide survey every five years. However, since 2019, vegetation surveys have been conducted based on 1:5,000 scale topographic maps. The ENM, which reflects the results of natural environment surveys, also incorporates data at the same scale and cycle (Fig. 2A). The survey results are compiled into four thematic maps: vegetation, endangered wild species, wetlands, and terrain. The ratings are evaluated by overlaying land cover maps and digital maps. The completed ENM is made available for public viewing for 45 days every February to incorporate public opinion, and after the period ends, the publication is officially announced by the Ministry of Environment (Korea Law Information Center, 2024a).
The UEM is prepared by local governments at the level of cities or above, with the head of the local government serving as the responsible party. Unlike the ENM, the UEM is created in a biotope (habitat) unit. The basic thematic maps used for preparation include land use status maps and land cover maps prepared by the Ministry of Environment, and terrain thematic maps (such as slope analysis maps, elevation analysis maps, and aspect analysis maps) prepared by the Ministry of Land, Infrastructure, and Transport. Field surveys are conducted to create thematic maps of the vegetation, fauna, and flora. Depending on the characteristics and requirements of the local government, additional thematic maps, such as watershed distribution maps and CO2 absorption analysis maps, can be incorporated for future use. The combined thematic maps, ‘Biotope Type Map’ and ‘Biotope Evaluation Map,’ are defined as the UEM (Korea Law Information Center, 2024b). As the UEM requires detailed spatial data for private property, public land, and small-scale development planning, a 1:5,000 scale is used as the standard (Fig. 2B).
The second difference relates to the data used to create maps. There are differences in the expression methods depending on the data utilized for each map. The ENM is created based on the results of 15 ecosystem survey projects conducted in accordance with Articles 30 and 31 of the Natural Environment Conservation Act. The main evaluation system is centered on species and habitat. Areas where endangered wild species appear are weighed by habitat, excluding simple occurrence cases. Thematic vegetation and terrain maps are created to reflect the results of the evaluations based on the habitat conservation grades. The vegetation and terrain conservation grade evaluations are managed and regulated by the administrative rules of the Ministry of Environment to ensure objectivity and credibility.
However, the UEM has a biotope-centered evaluation system. Biotopes are classified based on land-use units, and flora and fauna survey results. Although the map is created by local governments, biotope types are classified according to a table that divides the entire country into large, medium, and small systems, considering their use at the metropolitan level. The type table is managed and regulated by the administrative rules of the Ministry of Environment. However, to reflect the unique biotope types specific to some local governments (such as gotjawal or columnar joints), other types may be added.
The third difference relates to how the maps are reviewed. After completing the survey, each natural environment survey undergoes a data verification process conducted independently by an executing agency. The verified data is reflected in the ENM to draft the initial version, and the validity of the creation and grading is reviewed twice by experts in related fields. The final ENM undergoes a public surveying performance review by the Spatial Information Quality Management Institute to check its consistency and integrity as a digital map in accordance with Article 18 of the Spatial Information Management Act. Thus, the ENM undergoes a review process that is divided into data, grading, and precision to ensure accurate creation and credibility. After creation, the UEM is reviewed for data and grading validity by a local government review committee. Before submission to the Ministry of Environment, data consistency is reviewed by the National Institute of Ecology, and the final output is compiled.
The fourth difference relates to the classification of grades. The ENM is created using a three-grade system (Table 3). If any one of the four evaluation themes correspond to a first-grade reason, the area is evaluated as first-grade using the minimum indicator method. For example, if the vegetation is first grade, the area is evaluated as first grade, even if the endangered wild animals, wetlands, or terrain theme maps are not first grade. However, if the area includes ecosystems with artificial modifications, such as residential areas, rice paddies, fields, or bare land, the area is excluded from the first grade. The same applies to second grade. If any one of the four theme maps corresponds to second grade, the area is evaluated as second grade. The third grade is designated for areas other than those classified as first or second grade (NIE, 2025).
The UEM is classified into five grades, from Grade 1 to Grade 5, in order of excellence (Table 4). After overlapping the biotope and thematic maps for evaluation, the derived biotope health is used to assign grades. Biotopes are categorized into urban, rural, and natural biotope focus areas and are evaluated based on habitat function, topographical characteristics, potential for biological habitation, area and rarity, restoration capability, and ecological functionality. The evaluation utilizes the results obtained from the decision trees and value-aggregation matrices.
The fifth difference relates to the utilization criteria by grade. The ENM has utilization criteria by grade, as stipulated by the law. Grade 1 represents conservation, Grade 2 represents minimizing damage, and Grade 3 represents systematic development (Korea Legislation Research Institute, 2024). The UEM provides standards for map utilization fields through administrative rules; however, utilization criteria by grade are not established separately (Table 5).
The sixth difference relates to the announcement status. Once the ENM is completed and evaluated, it is made available for public viewing at the end of February every year and thereafter announced in the Republic of Korea’s Official Gazette (gwanbo.go.kr). The announced ENM has a legal effect and is used as official data for various development plan formulations and environmental impact assessments. In contrast, although some local governments determine the usage methods for UEM, its use is not determined through local government announcements.
Discussion
Systemic limitations and issues of the Ecological and Natural Map and Urban Ecological Map
A comprehensive comparison and analysis were conducted on the overall aspects of the ENM and UEM, including their purposes, preparation methods, and utilization. While the purposes were similar, some differences were found in the preparation data and methods as well as in the review and announcement processes. Based on a comparative analysis, the following improvements are proposed to promote activation and enhance the reliability of the two maps.
First, the scale of the ENM should be adjusted. In 2023, Korea enacted the “Joint Ordinance on Integrated Management of National Land Planning and Environmental Planning,” specifying integrated management, its scope, linkage methods, and procedures (Korea Law Information Center, 2023). Accordingly, the UEM applies a basic scale of 1:5,000, which is used for urban management plan formulation. However, the ENM, first created in 1997 and announced in 2007, is based on a 1:25,000 scale and does not follow the latest policy direction. Given the reality in Korea, in which urban overcrowding and development saturation have increased interest in natural ecosystem development, the basic scale should be changed to 1:5,000.
Second, the review procedure for the UEM should be improved. Unlike the ENM, which is reviewed by various experts and institutions from multiple organizations, the data and grading of the UEM are reviewed directly by the preparer. Although the UEM is prepared by city-level local governments, it can also be used as important data at the provincial (do) level. Gyeonggi Province, after using city-level UEMs, determined that the map has sufficient value for use at the provincial level for climate change, landscape conservation, biodiversity, and ecosystem services, and began preparing the map directly from 2025, providing services via the webpage ( https://climate.gg.go.kr). Because the UEM can be used at the provincial level, adding a review procedure by a provincial research institute would increase the map’s accuracy and help establish measures to enhance its use at the provincial level in the future.
Third, map utilization methods should be clarified. Legally, the ENM is stipulated in the Enforcement Decree of the Natural Environment Conservation Act for use as a reference in national and local comprehensive environmental plans and environmental impact assessments. In practice, environmental impact assessments, a major application area, use the ENM grades as one of eight reference materials under Article 6, Clause 3 of the “Regulations on Consultation Procedures for Environmental Impact Assessment Reports.” However, the UEM lacks specific legal provisions for utilization methods. A system without clear utilization guidelines can cause confusion among policymakers and users. Therefore, the UEM requires the establishment of utilization fields and grade-based utilization standards in the Enforcement Decree of the Natural Environment Conservation Act.
Fourth, the credibility of the UEM should be strengthened. The announced ENM is used as credible data with legal effects. However, the UEM is only specified by law for submission to the Minister of Environment after preparation, which may cause local governments and users to question its credibility. According to the principle of respecting local autonomy and the separation of announcement authority under the Local Autonomy Act, the central government’s Ministry of the Environment does not have the authority to announce the UEM prepared by local governments (Shim, 2010). Therefore, a revision is required to secure credibility through the announcement of the completed UEM through local government ordinances.
Finally, the objection procedure for the UEM should be established and clarified. The ENM is stipulated for use as a reference. However, administrative agencies use the ENM for environmental impact assessments or land development and restrict development based on ENM grades. While the primary purpose of the ENM is to serve as a reference, it may function as a regulatory instrument in practice. Accordingly, in cases where inconsistencies arise between actual conditions and the map, it is necessary to guarantee the right to raise objections based on the designated grade during the implementation stage (Ministry of Environment, 2022). This refers to the right to request map correction when discrepancies occur between the actual conditions and map. The ENM has procedures for “submission of opinions” and “objection” to prepare for such discrepancies. In contrast, although the UEM stipulates objection to grades in Article 18 of the Enforcement Rules, it is not clearly organized in “Guidelines for Preparing the UEM” for work processing. To properly establish a UEM system and protect user rights, an objection procedure must be added and operated.
Strategies for the integrated utilization of the Ecological and Natural Map and Urban Ecological Map
It has been identified that ENM and UEM require complementary improvements in different areas. To enhance these two maps, the following integrated utilization strategies are proposed. The results of the natural environment survey and the detailed ecosystem survey reflected in the ENM do not contain much information about urban areas; therefore, the utilization of ENM in urban areas has limitations. The UEM conducts natural environment surveys within the administrative boundaries of each local government and is created at a more detailed scale than the ENM, thus containing more information about urban areas compared to the ENM. Therefore, to overcome the limitations of the ENM, it is necessary to consider the use of the UEM for environmental policies in urban areas. As seen in the case of Gyeonggi Province, the UEM created by each local government can be used not only at the provincial level but also as an important resource that supplements the ENM at the national level. To this end, the central government (Ministry of the Environment) must consistently standardize the UEM data created by each local government, and local governments must develop strategies to utilize the UEM in environmental policies at a level comparable to that of the ENM.
Conclusion
This study compared the institutional operation, preparation methods, grade classification, and utilization systems of the ENM and UEM and proposed improvements for the arising issues. In a situation where no prior research exists on how maps with the same purpose are prepared and what differences exist, the priority is to assist policymakers and users in their understanding. Consequently, differences were identified in map preparers, preparation scope, basic scale, and utilization data. Moreover, improvements such as precision enhancement, legal revision for credibility assurance, and clarification of utilization methods were proposed.
Environmental policy is directly connected to the lives of people, and therefore must be composed and implemented very precisely. The improvements suggested in this study can serve as important reference materials for enhancing the system completeness. However, as the significance of this study lies in being the first comparative analysis of the two maps, focusing largely on preparation and utilization, limitations in the additional legal analysis were identified. Future research should include legal analyses to enable the application and utilization of environmental policies from multiple perspectives.
Author Contributions
Funding acquisition: WO. Methodology: WO. Resources: HYY. Software: HYY. Supervision: WO. Writing – original draft: WO. Writing – review & editing: HYY, JC.
Funding
This work was supported by a grant from the National Institute of Ecology (NIE), funded by the Ministry of Environment (MOE) of the Republic of Korea (NIE-A-2025-03).
References
, , (2022) A study on the estimation method of carbon storage using environmental spatial information and InVEST carbon model: focusing on Sejong special self-governing city-using ecological and natural map, environmental conservation value assessment map, and urban ecological map Journal of the Korean Society of Environmental Restoration Technology, 25, 15-27 .
Korea Law Information Center. (2023). Joint Ordinance on Integrated Management of National Land Planning and Environmental Planning. Retrieved Aug 20, 2025 from https://www.law.go.kr/%ED%96%89%EC%A0%95%EA%B7%9C%EC%B9%99/%EA%B5%AD%ED%86%A0%EA%B3%84%ED%9A%8D%EB%B0%8F%ED%99%98%EA%B2%BD%EA%B3%84%ED%9A%8D%EC%9D%98%ED%86%B5%ED%95%A9%EA%B4%80%EB%A6%AC%EC%97%90%EA%B4%80%ED%95%9C%EA%B3%B5%EB%8F%99%ED%9B%88%EB%A0%B9/(1593,20230314).
Korea Law Information Center. (2024a). Ministry of Environment Directive No. 753 (2024.9.11) "Guidelines for Preparing the Ecological and Natural Map". Retrieved Aug 20, 2025 from https://www.law.go.kr/admRulLsInfoP.do?admRulSeq=2100000199219.
Korea Law Information Center. (2024b). Ministry of Environment Notification No. 2024-251 (2024.12.5) "Guidelines for Preparing the Urban Ecological Map". Retrieved Aug 20, 2025 from https://www.law.go.kr/LSW//admRulInfoP.do?admRulSeq=2100000249938&chrClsCd=010201.
Korea Legislation Research Institute. (2024). Natural Environment Conservation Act. Retrieved Aug 20, 2025 from https://elaw.klri.re.kr/kor_service/lawView.do?hseq=64575&lang=KOR.
Ministry of Environment. (2022). Study on the improvement of the legal system for rational operation of the ecological natural map system. Retrieved Aug 20, 2025 from https://www.prism.go.kr/homepage/asmt/popup/1480000-202300097.
Ryu, S.H., Kim, S.Y., and Kim, H.C. (2018). 50 years of industrial complex development: achievements and challenges. Korea Research Institute for Human Settlements. Retrieved Aug 20, 2025 from https://library.krihs.re.kr/library/10120/contents/6585767.
Figures and Tables
Fig. 1
A mapping scope of the ENM and UEM (black line: administrative district boundaries). (A) ENM mapping scope (nationwide). (B) UEM mapping scope (cities with population of 300,000 or more). SMZ, separately managed zones; ENM, Ecological and Natural Map; UEM, Urban Ecological Map.
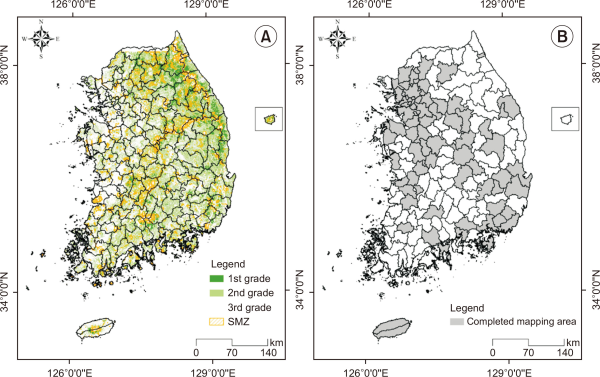
Fig. 2
A grade classification system comparative of the ENM and UEM (case area: Gochang-gun). (A) ENM grades classification system (Grades 1-3 and SMZ). (B) UEM grades classification system (I-V). SMZ, separately managed zones; ENM, Ecological and Natural Map; UEM, Urban Ecological Map.
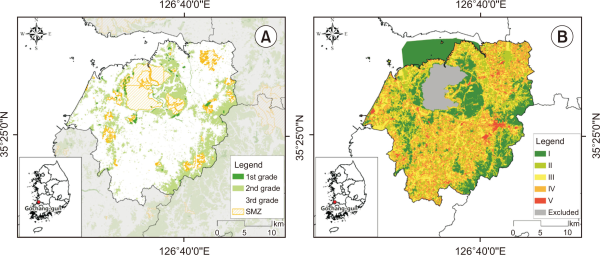
Table 1
Comparison of the administrative rules of ENM and UEM
| Category | Administrative rules of ENM | Administrative rules of UEM |
|---|---|---|
| The purpose of mapping | Chapter 1. General Provisions | Chapter 1. General Provisions |
| Creating a map | Chapter 2. How to Create an ENM | Chapter 2. Organization and Preparation Principles of UEM Chapter 3. Method of Researching and Creating a Topic Map Chapter 4. Principles and Methods for the Type of UEM Chapter 5. Method of Evaluation of UEM Chapter 6. Research on Representative Biotopes and Excellent Biotopes |
| Review | - | Chapter 7. Review and Operation of UEM |
| Public notification | Chapter 3. Regular Examination of ENM Chapter 4. Appeals and Occasional Public Notification of ENM |
- |
Source: Korea Law Information Center (2024a; 2024b), Korea Legislation Research Institute (2024).
Table 2
Comparison table of ENM and UEM
| Category | ENM | UEM |
|---|---|---|
| Main agent of production | Nation | Local governments of city level or higher |
| Scope of preparation | Entire national territory (excluding some unpreparable areas and marine areas) | Local government |
| Scale | 1:25,000 | 1:5,000 |
| Grade criteria | Species and habitat-based value | Biotope health |
| Thematic map | Existing vegetation map | Land use map |
| Endangered wildlife distribution map | Land cover status map | |
| Topographic map | Slope analysis map | |
| Land cover status map | Elevation analysis map | |
| Aspect analysis map | ||
| Existing vegetation map | ||
| Flora and fauna habitat map | ||
| Review | Step 4 (data-preparation-grading-consistency) | Step 2 (preparation and grading-consistency) |
Table 3
Evaluation criteria by ENM grades
| Grade | Vegetation conservation grades | Endangered wild species grades | Topography conservation grades | Wetland |
|---|---|---|---|---|
| 1st | I, II | I, II | I | - Wetlands where two or more endangered wild species breed and grow - Wetlands inhabited by 6 or more endangered wild species - Wetlands where over 20,000 migratory birds have arrived in the past 5 yr, and 4 or more endangered wild bird species have been observed - Lakes inhabited by 20 or more fish species - 100 m buffer zone around wetlands |
| 2nd | III, IV | - | II | - Wetlands inhabited by 2 to 5 endangered wild species - Wetlands where more than 5,000 migratory birds have arrived in the past 5 yr, and more than 2 species of endangered wild bird species have arrived - Natural lakes inhabited by 11 to 19 species of fish |
| 3rd | Areas other than ENM 1st grade, 2nd grade and SMZ | |||
Table 4
Evaluation criteria of UEM grades
| Grade | Evaluation criteria |
|---|---|
| I | Biotopes with no human interference or long-term stable and mature biotopes Biotopes with high naturalness that cannot be replaced and require absolute conservation |
| II | Biotope with moderate human interference and medium sensitivity to damage, showing
a declining trend Biotope with a certain level of naturalness, high potential for ecological value improvement after restoration, and conditionally replaceable |
| III | Biotope with high human interference, low sensitivity to damage, and low naturalness, requiring medium- to long-term regeneration |
| IV | Biotope with very high human interference and low potential for natural regeneration |
| V | Biotope with excessive energy use and disrupted circulation system, with no potential for natural regeneration |
Table 5
Utilization criteria by grades for ENM and UEM
| Category | Utilization method | |
|---|---|---|
|
|
||
| ENM | UEM | |
| Grade 1 | Conservation and restoration of the natural environment | N/A |
| Grade 2 | Minimization of damage caused by conservation, development, and use of the natural environment | N/A |
| Grade 3 | Systematic development and use | N/A |
| Grade 4 | Not classified | N/A |
| Grade 5 | Not classified | N/A |
| Systematic development and use | According to each law | N/A |