Introduction
The Ecological and Natural Map is a nationwide mapping system established under the Natural Environment Conservation Act. It classifies the natural environment across South Korea, including mountains, rivers, inland wetlands, lakes, agricultural lands, and urban areas, into graded categories based on ecological, natural, and scenic values. This classification is derived from various national-scale environmental surveys, such as the National Natural Environment Survey, National Inland Wetlands Survey, and Winter Bird Census, and categorizes regions into grades 1, 2, 3, and specially managed areas (NIE, 2023).
As comprehensive repositories of ecological data, the Ecological and Natural Map serves as fundamental resource for a wide range of ecological and environmental studies. In particular, it provides an extensive database of vegetation types and plant communities throughout South Korea, enabling monitoring of annual changes in vegetation and shifts in community distribution and extent.
In this study, we utilized the Ecological and Natural Map to analyze 10-year trends and spatial changes in three dominant plant communities: Quercus mongolica, Quercus variabilis, and Pinus densiflora. The primary objectives of this study were to elucidate the patterns of vegetation succession, assess community dynamics, and explore the extent to which these patterns were influenced by forest management practices.
In South Korea, members of the genus Quercus cover significantly larger areas than other tree species groups (Kim et al., 2009). The major species include Quercus acutissima, Q. variabilis, Q. mongolica, Quercus aliena, Quercus dentata, and Quercus serrata, along with 12 naturally occurring hybrids spanning 6 taxonomic groups (Lee, 2003).
The three focal species in this study, Q. mongolica, Q. variabilis, and P. densiflora, are among the most dominant and widely distributed forest communities in the Korean Peninsula, and have been extensively studied. Research on Quercus species has examined topics such as the growth and water physiology of Q. variabilis under varying site conditions (Chung & Shin, 2003), phytosociological analyses of Q. mongolica forests (Song et al., 2003), and soil respiration in Q. acutissima stands (Lee & Mun, 2001). Studies on P. densiflora have addressed the classification and geographic distribution of Korean pine forests (Chun & Lee, 2007), silvicultural strategies based on vegetation type (Lee et al., 2009), and the phytosociological perspectives of pine forest conservation (Bae & Lee, 1999).
Despite the extensive body of species- and community-level research, no comprehensive study has yet examined the overall area changes, successional trajectories, and responses to developmental pressures in these three major forest communities.
Therefore, this study analyzed the 10-year data for spatial changes in the distribution of Q. mongolica, Q. variabilis, and P. densiflora, using the Ecological and Natural Map. Through this analysis, we aimed to reveal trends in vegetation succession, characterize community change patterns, and assess the extent to which artificial forest management, rather than natural factors such as climate, nutrient availability, or water supply, has shaped the dynamics of these communities.
Materials and Methods
Verification of vegetation conservation grades
The vegetation conservation grades were verified based on the Ecological and Natural Map integration dataset, which was compiled using vegetation survey data from the National Natural Environment Survey. Using the QGIS program (QGIS Geographic Information System Version 3.34; QGIS Association, Zürich, Switzerland), we extracted vegetation conservation grades over the past 10 years for three major communities—Q. mongolica, Q. variabilis, and P. densiflora—and calculated the areas corresponding to each grade.
The vegetation dataset of the Ecological and Natural Map consists of five conservation grades from Grade I to Grade V. Accordingly, the vegetation conservation grades for each community were extracted annually across these five categories. Grade V was excluded from this study because it represents areas such as residential zones, water bodies, and developed lands, where the ecological function of vegetation communities is minimal. Therefore, only data up to Grade IV were included in the analysis. Furthermore, mixed forests containing two or more communities were excluded from the analysis. Only areas identified as pure, single-species communities in the Ecological and Natural Map were selected for this study.
Analysis of community area within the Ecological and Natural Map
As mentioned above, the vegetation communities in the Ecological and Natural Map were categorized into five vegetation conservation grades, which were then reclassified into three ecological grades: Grades I and II correspond to Ecological Grade 1; Grades III and IV to Ecological Grade 2; and Grade V to Ecological Grade 3 (NIE, 2023).
Five annual vegetation conservation grades were categorized into this three-level ecological grading system, and the total area changes over time for the three communities were analyzed. All area measurements were standardized in square meters (m2), and temporal trends were assessed to identify annual changes in the extent of distribution of each community.
Results and Discussion
The baseline data, calculated as the area of vegetation conservation grade changes over the past decade within the Ecological and Natural Map for Q. mongolica, Q. variabilis, and P. densiflora communities, are summarized in Table 1. Species-specific analyses were conducted based on baseline data.
A comprehensive graph based on the above chart is shown in Fig. 1.
Changes in vegetation conservation grades of the Quercus mongolica community
Q. mongolica forms the largest community among the species of the Quercus genus in the Korean Peninsula (South Korea), both in terms of distribution and extent, and is also the most widely distributed Quercus community in the Ecological and Natural Map.
Over the past 10 years, the Q. mongolica community has shown a gradual decline in the area within the Ecological and Natural Map (Fig. 2). In particular, there has been a notable decrease in the vegetation conservation Grades I and II, which correspond to Ecological Grade 1. Among these, the decline in Grade I has been especially pronounced.
In addition, the Q. mongolica community showed a decreasing trend, even in Grade IV areas. This suggests that the decline was not merely a shift in conservation grades within the community, but rather a continued reduction in the total area occupied by Q. mongolica. This trend could be interpreted as a decrease in the population of mature individuals capable of forming stable communities across South Korea.
Changes in the vegetation conservation grades of the Quercus variabilis community
In contrast, the Q. variabilis community exhibited a consistent annual increase in distribution. Although its total habitat area remains smaller than that of Q. mongolica and the area classified as Vegetation Conservation Grade I is still minimal, the area corresponding to Grade II has been gradually increasing. This indicates a continuous expansion of areas designated as Ecological Grade 1 within the ecological and natural maps, specifically in pure Q. variabilis communities.
Moreover, most of the Q. variabilis communities are concentrated under Vegetation Conservation Grade III, which corresponds to Ecological Grade 2, and possibly, most of the Q. variabilis distribution across South Korea falls within this grade. Notably, the area occupied by Q. variabilis in Grade III has been steadily expanding over the years (Fig. 3).
Changes in the vegetation conservation grades of the Pinus densiflora community
P. densiflora forms the largest single-species community in the Korean Peninsula (South Korea) and is the most extensively distributed plant community in the Ecological and Natural Map. However, over the past decade, all vegetation conservation grades in the P. densiflora community have gradually declined. This indicates that regardless of the conservation grade, the overall extent of P. densiflora communities has been continuously decreasing across South Korea.
Notably, in 2013, the area of pure P. densiflora communities classified as Vegetation Conservation Grade I was recorded at a substantial 133,467,329 m2. However, by 2023, this area had drastically reduced to 36,445,806 m², representing a loss of nearly 100,000,000 m2 over the past decade (Fig. 4).
In addition, a continuous decline has been observed over the past decade in Vegetation Conservation Grade III, which occupies the largest area among P. densiflora communities.
Primary causes of the decline in the Quercus mongolica community
The Q. mongolica community occupies the largest area among the four major genera of Quercus spp. (Q. mongolica, Q. variabilis, Q. serrata, and Q. acutissima) in the Korean Peninsula (South Korea). In other words, Q. mongolica is the most widely distributed genus Quercus spp. in this region. This broad distribution is attributable to its optimal habitat conditions, with a Warmth Index of 55-90°C·month, latitudinal range of 35-38° N, and altitudinal range of 200-1,400 m (Kim et al., 1988; Oh et al., 2013; Yim & Kim, 1992), all of which are well-represented across South Korea.
Additionally, Q. mongolica is predominantly found around higher-elevation ridges, where human disturbances and developmental pressures tend to be low (Choung, 1998). Compared to other Quercus spp., Q. mongolica exhibits a broader ecological niche, largely because of its high adaptability to varying light conditions (Lee & You, 2009), which has contributed to its dominance in the Korean Peninsula. As a result, the Q. mongolica community typically shows higher proportions of Vegetation Conservation Grade I than the other major Quercus spp.
However, the results of this study indicate that the Q. mongolica community has experienced a gradual decline in both area and extent over time. According to Lee and Kim (1995), during the post-slash-and-burn succession process, Q. mongolica competes with P. densiflora during the mid-successional stage (25-50 years) and is expected to persist as a pure stand during the late successional stage (50-80 years). Under normal successional trajectories, the area occupied by Q. mongolica should remain stable or even expand. Nevertheless, our findings revealed a continuous reduction in the community area.
The decline in the Q. mongolica community appeared to be driven by a combination of factors, with two major causes identified as below:
Oak wilt disease
Globally, the decline in oak species (Quercus spp.) has emerged as a significant ecological concern, with oak wilt disease identified as the primary cause of mass mortality events. A major outbreak occurred in South Korea when the ambrosia beetle (Platypus koryoensis), first reported in 1935, experienced an explosive population increase, leading to widespread infestations. The primary host species is Q. mongolica, particularly mature and large-diameter trees (Kim, 2007).
The scale of damage was substantial: in 2004, approximately 10,250 infected trees were recorded, and by 2006, this number surged to 194,419 trees. Continuous damage from oak wilt disease has been reported since 2020 (Kim et al., 2020).
According to Lee and Um (2014), most cases of oak wilt occur in Q. mongolica, which has a disproportionately high impact on medium- and large-diameter trees. This study further highlighted a clear preference for Q. mongolica over other Quercus spp. Consequently, it can be inferred that the ongoing decline in Q. mongolica communities across South Korea is largely due to the mortality of medium- and large-diameter individuals, particularly those with Vegetation Conservation Grades I and II, due to oak wilt disease.
Forest management practices
According to Article 2, Clause 3 of the Forest Resources Management Act (abbreviated as the Forest Resources Act) of South Korea, forest management practices refer to activities carried out within forests for the creation, cultivation, utilization, disaster prevention, restoration, and recovery of resources to maintain, enhance, or restore forest functions. Management activities such as thinning (forest tending) and logging are actively implemented to improve both the economic value and ecological functions of forests, resulting in the annual removal of large forest areas.
These forest management practices are shaped by the policy dynamics between the Ministry of the Environment, which oversees the Ecological and Natural Map, and the Korea Forest Service, which is responsible for forest policies and operations. Consequently, forest management activities under the jurisdiction of the Korea Forest Service have a significant impact on the vegetation conservation grades designated by the Ministry of Environment.
The area of forest management activities within Ecological Grade 1 regions was 23,964,000 m2, accounting for 5.6% of the total forest management area (427,547,000 m2) (Table 2). Among these, logging accounted for 10,525,000 m2 (43.9 %), forest tending 7,024,000 m2 (29.3 %), and afforestation 6,414,000 m2 (26.8%). Additionally, the average elevation of forest management sites within Ecological Grade 1 regions was 356 m. Logging areas were found to have the highest mean and maximum elevations among the management types, as well as the largest elevation range (minimum 7 m to maximum 1,121 m).
Additionally, according to the felling permit data provided by the Korea Forest Service, the analysis of felling volume by tree species revealed the species that had been harvested. The most representative oak species were included in the category Quercus spp. In 2021, approximately 148,460,000 m2 of Quercus spp. forests were felled, and this figure increased to approximately 158,140,000 m2 by 2022. These data indicate that on average, approximately 150,000,000 m2 of oak forests are harvested annually. Such extensive harvesting directly affects the grading of the Ecological and Natural Map, contributing to the downgrading of conservation grades.
As discussed earlier, the combined impact of oak wilt disease in Q. mongolica and the widespread, indiscriminate felling of oak species each year were identified as the primary drivers of the continuous decline in Q. mongolica community area. Although Q. mongolica grows predominantly at higher elevations (Chung & Lee, 1998), where human disturbance is relatively low, oak wilt occurs regardless of elevation. Furthermore, in the context of forest management activities such as clear-cutting, thinning, and logging, Quercus spp. rank among the most frequently felled species nationwide, second only to P. densiflora. Thus, the decline in Q. mongolica communities can be interpreted as a result of the combined effects of both factors.
Decline of the Pinus densiflora community and expansion of the Quercus variabilis community
The P. densiflora community has also been confirmed to have gradually declined over the past 10 years. Distributed across most regions of South Korea, excluding high-altitude mountainous areas, P. densiflora represents the largest single-species forest in terms of area, and is considered one of the country’s most important economic tree species (Yang, 2002). This species occupies the largest community area in the Ecological and Natural Map as well. However, based on the results of the present study, a decline in the P. densiflora community is undeniable. Two primary factors were identified as the main drivers of this decline.
Pests and diseases, including the pine gall midge (Thecodiplosis japonensis) and pinewood nematode (Bursaphelenchus xylophilus), have driven subsequent clear-cutting and thinning
As many as 147 pest species have been recorded in Pinus spp. (FRI, 1995), among which the pinewood nematode (Bursaphelenchus xylophilus), pine gall midge (Thecodiplosis japonensis), and pine bast scale (Matsucoccus thunbergianae) are considered the most problematic (Lee et al., 2008). These pests and diseases hinder the normal growth of Pinus spp. and have a significant impact on the vegetation conservation grades of P. densiflora communities in the Ecological and Natural Map.
The area affected by the pine gall midge (T. japonensis) averaged 324,764,000 m2 annually over the five-year period from 2017 to 2021, while the pine bast scale (M. thunbergianae) affected an average of 53,462,000 m2 per year, indicating that numerous P. densiflora communities are infected by pine-related diseases each year (Table 3). In addition, pine wilt disease caused by the pinewood nematode (B. xylophilus), which has recently emerged as a major problem not only in East Asia, including the Korean Peninsula and China, but also in Europe, has been confirmed to affect an average of 450,000 P. densiflora communities annually in South Korea (Kim et al., 2015), which has led to subsequent control measures, including clear-cutting and thinning operations (Table 4).
Such infections in P. densiflora communities lead to the mortality of numerous trees. Control measures, including chemical treatments, partial clear-cutting, and thinning of the affected P. densiflora stands, exert both short- and long-term impacts on these communities. These interventions suppressed the normal growth of P. densiflora, and as a result, it was concluded that the area occupied by P. densiflora within the Ecological and Natural Map inevitably decreased annually.
The logging of numerous Pinus densiflora
P. densiflora is the most extensively logged single-species tree in the Korean Peninsula (South Korea). By 2021, approximately 474,690,000 m2 of P. densiflora communities were logged, and in 2022, the logged area increased to approximately 627,190,000 m2 (Table 5). Each year, many P. densiflora trees are harvested for economic value, species renewal, and forest management. This extensive logging has become a decisive factor contributing to the decline in the vegetation conservation grades of P. densiflora communities in the Ecological and Natural Map over the past decade.
Increase of the Quercus variabilis community
Competition is generally classified as intraspecific competition (within the same species) and interspecific competition (between different species) (Chung & Lee, 1998). In South Korea, P. densiflora and Q. variabilis engage in interspecific competition across many countries, often co-occurring in harsh mountainous environments at around 600 m of elevation, where they sometimes form a partial edaphic climax (Kim & Kil, 2000). In these areas, Q. variabilis is frequently found mixed with Q. mongolica. Q. variabilis spans the habitat ranges of both Q. mongolica and P. densiflora, making it one of the most prominent competitors of these species in South Korea.
Q. mongolica and P. densiflora have been steadily declining over the past decade owing to oak wilt disease, forest management activities, pine wilt disease, and extensive logging. In contrast, Q. variabilis, the competing species, continued to expand. A key reason for this is its greater resistance to oak wilt disease compared to Q. mongolica and the relatively lower levels of logging compared to P. densiflora. Furthermore, resprouting-based regeneration and reforestation efforts, which are often conducted as part of forest management practices, predominantly involve oak species, particularly Q. variabilis. Considering that most forests are now under the management of the Korea Forest Service, the expansion and maintenance of Q. variabilis communities appear to have resulted from anthropogenic management rather than natural succession. This is reflected in the fact that over the past decade, Q. variabilis communities have maintained their conservation grades in the Ecological and Natural Map.
Conclusion
This study analyzed changes in the dominant communities of Q. mongolica, P. densiflora, and Q. variabilis in the southern Korean Peninsula over the past decade using data from the Ecological and Natural Map. The results revealed that the communities of Q. mongolica and P. densiflora have gradually declined in the area owing to continuous forestry projects, pest outbreaks, and subsequent logging, whereas the Q. variabilis community has steadily expanded, gaining a competitive advantage. These findings indicate that forestry projects and immediate logging as pest control measures play a decisive role in driving short-term changes in the forest vegetation structure. However, the current pest control and forestry project-oriented policies of the Korean Forest Service conflict with the ecosystem conservation policies pursued through the Ecological and Natural Map of the Ministry of Environment. In particular, large-scale logging conducted for timber supply and pest control may provide short-term economic and protective benefits. However, in the long term, it risks undermining forest ecosystem stability and the conservation value emphasized in the Ecological and Natural Map. Therefore, future forest management policies should move beyond an approach centered solely on forestry projects, logging for timber production, and pest control. Instead, they should establish legislated management standards based on the coordination and cooperation between the Korea Forest Service and the Ministry of Environment. In addition, a sustained and systematic monitoring system for forest vegetation changes should be implemented to ensure that forestry projects and ecosystem conservation goals function in a complementary manner. Such measures are essential for strengthening the resilience and long-term sustainability of forest ecosystems.
Author Contributions
Conceptualization: KHP. Data curation: KHP, DHS. Formal analysis: KHP, DHS. Funding acquisition: KHP. Methodology: KHP. Validation: KHP. Visualization: KHP. Writing – original draft: KHP. Writing – review & editing: KHP.
Funding
This study was supported by the National Institute of Ecology, funded by the Ministry of Environment of the Republic of Korea (NIE-A-2024-02).
Figures and Tables
Fig. 1
Changes in vegetation class Quercus mongolica, Quercus variabilis, and Pinus densiflora in the past 10 years.
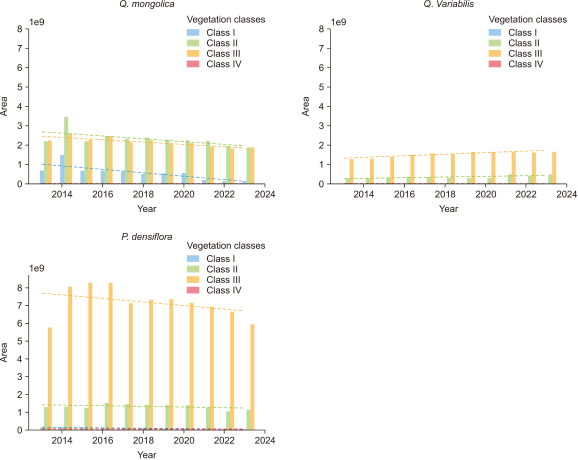
Fig. 2
Temporal trends of vegetation classes in Quercus mongolica from 2013 to 2023. (A) Vegetation Class I. (B) Vegetation Class II. (C) Vegetation Class III. (D) Vegetation Class IV.
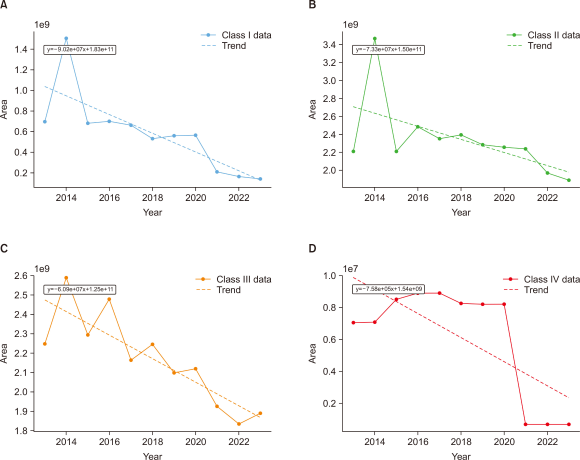
Fig. 3
Temporal trends of vegetation classes in Quercus variabilis from 2013 to 2023. (A) Vegetation Class I. (B) Vegetation Class II. (C) Vegetation Class III. (D) Vegetation Class IV.
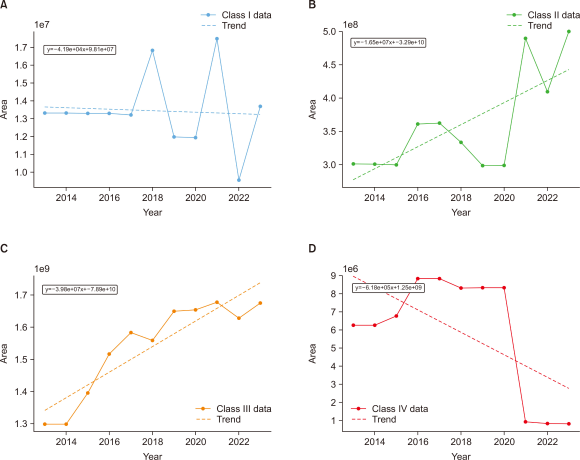
Fig. 4
Temporal trends of vegetation classes in Pinus densiflora from 2013 to 2023. (A) Vegetation Class I. (B) Vegetation Class II. (C) Vegetation Class III. (D) Vegetation Class IV.
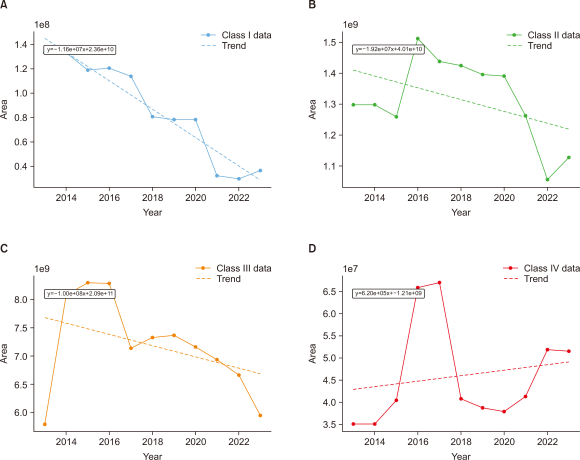
Table 1
Changes in vegetation class of Quercus mongolica, Quercus variabilis, Pinus densiflora in the past 10 years (m2)
| Year | Vegetation class s | Vegetation class II | Vegetation class III | Vegetation class IV | Total | |
|---|---|---|---|---|---|---|
| Q. mongolica | 2013 | 698,492,003 | 2,208,843,866 | 2,250,193,983 | 7,054,077 | 5,164,583,929 |
| 2014 | 1,503,614,334 | 3,469,882,893 | 2,589,502,972 | 7,103,826 | 7,570,104,025 | |
| 2015 | 682,943,098 | 2,208,306,404 | 2,294,776,636 | 8,540,671 | 5,194,566,809 | |
| 2016 | 700,328,625 | 2,484,951,382 | 2,480,352,212 | 8,921,057 | 5,674,553,276 | |
| 2017 | 663,426,952 | 2,352,418,723 | 2,165,007,134 | 8,921,057 | 5,189,773,866 | |
| 2018 | 534,059,664 | 2,393,109,911 | 2,246,842,651 | 8,274,571 | 5,182,286,797 | |
| 2019 | 560,015,381 | 2,283,210,511 | 2,099,806,226 | 8,221,611 | 4,951,253,729 | |
| 2020 | 565,718,634 | 2,255,557,322 | 2,120,925,709 | 8,221,611 | 4,950,423,276 | |
| 2021 | 210,910,136 | 2,238,833,618 | 1,926,557,809 | 666,678 | 4,376,968,241 | |
| 2022 | 165,554,492 | 1,968,600,224 | 1,835,668,440 | 666,678 | 3,970,489,834 | |
| 2023 | 142,631,249 | 1,885,537,702 | 1,890,448,686 | 664,960 | 3,919,282,597 | |
| Q. variabilis | 2013 | 13,334,291 | 301,713,653 | 1,297,693,285 | 6,259,957 | 1,619,001,186 |
| 2014 | 13,334,291 | 301,035,048 | 1,297,719,680 | 6,259,957 | 1,618,348,976 | |
| 2015 | 13,310,186 | 299,922,137 | 1,395,540,252 | 6,779,897 | 1,715,552,472 | |
| 2016 | 13,300,253 | 361,033,387 | 1,515,309,972 | 8,837,324 | 1,898,480,936 | |
| 2017 | 13,215,644 | 362,633,336 | 1,582,576,750 | 8,837,324 | 1,967,263,054 | |
| 2018 | 16,823,871 | 333,851,182 | 1,558,304,362 | 8,300,142 | 1,917,279,557 | |
| 2019 | 11,991,885 | 298,757,256 | 1,648,606,136 | 8,330,858 | 1,967,686,135 | |
| 2020 | 11,957,665 | 299,477,883 | 1,653,117,629 | 8,330,858 | 1,972,884,035 | |
| 2021 | 17,474,026 | 489,887,956 | 1,676,612,294 | 924,793 | 2,184,899,069 | |
| 2022 | 9,571,561 | 409,661,868 | 1,626,603,957 | 840,357 | 2,046,677,743 | |
| 2023 | 13,705,372 | 500,864,547 | 1,674,212,003 | 817,307 | 2,189,599,229 | |
| P. densiflora | 2013 | 133,467,329 | 1,297,969,490 | 5,785,679,082 | 35,164,512 | 7,252,280,413 |
| 2014 | 133,311,466 | 1,297,667,481 | 8,078,638,418 | 35,164,512 | 9,544,781,877 | |
| 2015 | 119,121,798 | 1,258,113,426 | 8,300,217,417 | 40,541,386 | 9,717,994,027 | |
| 2016 | 120,777,831 | 1,511,745,834 | 8,293,928,380 | 66,037,735 | 9,992,489,780 | |
| 2017 | 114,052,448 | 1,438,556,917 | 7,137,932,340 | 67,082,869 | 8,757,624,574 | |
| 2018 | 80,760,958 | 1,424,113,191 | 7,325,219,285 | 40,838,237 | 8,870,931,671 | |
| 2019 | 78,545,423 | 1,395,588,765 | 7,367,522,557 | 38,781,863 | 8,880,438,608 | |
| 2020 | 78,447,797 | 1,390,468,151 | 7,161,210,131 | 38,002,136 | 8,668,128,215 | |
| 2021 | 32,242,267 | 1,262,148,596 | 6,934,399,399 | 41,432,361 | 8,270,222,623 | |
| 2022 | 29,804,581 | 1,053,130,507 | 6,663,849,229 | 52,015,890 | 7,798,800,207 | |
| 2023 | 36,445,806 | 1,125,794,241 | 5,944,980,927 | 51,670,901 | 7,158,891,875 |
Table 2
Current status of forest management in Ecological and Natural Map first-grade zones
| Class | Area | Altitude (m) | ||||
|---|---|---|---|---|---|---|
|
|
|
|||||
| Area (m2) | Ratio (%) | Average | Lowest | Highest | ||
| Logging | 10,525,000 | 43.9 | 401 | 7 | 1,121 | |
| Forest tending | 7,024,000 | 29.3 | 351 | 12 | 878 | |
| Reforestation | 6,414,000 | 26.8 | 277 | 19 | 1,058 | |
| Total | 23,964,000 | 100.0 | 356 | 7 | 1,121 | |
Table 3
Damage area and frequency by tree species–pine gall-midge, black pine bast scale (m2)
| 2017 | 2018 | 2019 | 2020 | 2021 | |
|---|---|---|---|---|---|
| Pine gall-midge (Thecodiplosis japonensis) |
357,070,000 | 389,760,000 | 325,310,000 | 275,300,000 | 276,380,000 |
| Black pine bast scale (Matsucoccus thunbergianae) |
40,430,000 | 77,180,000 | 63,800,000 | 50,240,000 | 35,660,000 |
| Total | 774,470,000 | 805,650,000 | 698,120,000 | 634,460,000 | 609,660,000 |