
- P-ISSN2287-9099
- E-ISSN2287-4577
- SCOPUS, KCI

Scientometric Evaluation of Research Institutions: Identifying the Appropriate Dimensions and Attributes for Assessment
Wolfgang G. Stock (Department of Information Science, Heinrich Heine University Düsseldorf, Düsseldorf, Germany)

Gerhard Reichmann (Department of Operations and Information Systems, University of Graz, Graz, Austria)

Abstract
Many descriptions and evaluations of research institutions apply publication and citation indicators, which can also be found in most of the popular rankings of universities all over the world. When comparing different institutions, the question arises whether scientometric indicators, and institutional rankings derived from them, are really valid. In our paper we discuss various dimensions of scientometric analyses which have a more or less strong impact on the results of research evaluations on the scientometric meso-level (e.g., department or university level). Concerning research output (based upon publications), we found nine different dimensions, namely time period, size of the institution, representatives of the institution, data source, language, document types and their weighting, co-authorship, document length, and access option. Concerning research impact (based upon citations), there are 14 different dimensions. Using the simple example of two university departments, we present different rankings while varying a few attributes of the suggested dimensions. As the results show, there are large differences between the performed rankings. Each ranking stresses a different aspect; hence there is not the one and only valid ranking. All the popular global university rankings work with arbitrary selections of indicator combinations, making the results more or less arbitrary. The greatest issues are the rankings’ incomplete empirical bases, the non-consideration of fractional counting of authors, and – most importantly – the disregarding of the institutions’ sizes.
- keywords
- research evaluation, scientometrics, rankings, multi-dimensional evaluation, university departments
1. INTRODUCTION
Many evaluations of research institutions apply purely quantitative scientometric indicators, which are based upon publication and citation counts (Yang & Lee, 2013). The challenge of scientometrics is to quantify quality (Yang & Lee, 2018) as well as possible. Often, research evaluations use only a few indicators or even just one. In practice, problems with the ranking of research institutions often become apparent in the course of university rankings, since these are carried out frequently. In particular, worldwide university rankings are very popular (Kochetkov, 2024) and sometimes even lead to reports in newspapers. Some examples of such rankings with different approaches include:
the Academic Ranking of World Universities (ARWU) (established in 2003), initially published by the Shanghai Jiao Tong University, and since 2009 distributed by the Shanghai Ranking Consultancy, located in China,
the Quacquarelli Symonds World University Rankings (QS) (founded in 2004 together with THE), which has its headquarter in London (UK) and has numerous offices in many countries of the world,
the Times Higher Education World University Ranking (THE) (established in 2004, independent from QS since 2010), published by TSL Education and located in London, UK,
the Webometric University Ranking (since 2004) by the Cybermetrics Lab of the Spanish National Research Council in Madrid,
the Leiden Ranking, existing since 2006, compiled by the Centrum voor Wetenschap en Technologische Studies at Leiden University in the Netherlands, and, finally,
the U.S. News Best Global Universities, produced by U.S. News & World Report with headquarters in Washington, DC, and New York, NY (established in 2014 for the international ranking, while the national American ranking started in 1983).
ARWU, also known as Shanghai Ranking, considers research awards (e.g., Nobel prizes), field-specific and highly cited researchers (from Clarivate), articles published in top journals (such as Nature or Science) and indexed by multidisciplinary bibliographic information services (here Web of Science [WoS]), and performance per capita (Liu & Cheng, 2005). Very important aspects of ARWU are overall research output and top-notch researchers (Dehon et al., 2010). In contrast, THE Ranking applies data from opinion surveys on university reputation, the faculty per student ratio, the number of citations per faculty, the extent of international faculty, and the number of international students (Baty, 2013); furthermore, THE changes their selection of concrete indicators from time to time. It covers mainly the university’s perceived reputation, its research impact (based upon data from WoS), its resources for teaching, and its internationality. QS Ranking is similar to THE (both institutions originally cooperated). QS works with surveys on research activity, employers’ surveys, citations per faculty, the faculty-student ratio, and the numbers of international faculty and students (Huang, 2012). In THE Ranking, survey data is weighted at 30%, while QS is more dependent on surveys (50%). Leiden Ranking is based on publication output, citation impact, and scientific collaboration; all data are retrieved from Clarivate’s Science Citation Index and Social Sciences Citation Index (Waltman et al., 2012). The U.S. News Best Global Universities Ranking uses survey data on research reputation by Clarivate (weighted at 25%) and the number of publications, as well as the number and percentage of the most cited publications (data from Clarivate’s InCites), and international collaboration (Morse & Wellington, 2024). The Webometric University Ranking analyses the universities’ web presence performance, such as the number of web pages, “rich” files (e.g., PDFs), and external links to the university’s websites (Aguillo et al., 2008). This may be an indicator for the size of online published information and of the access to this information, but is by no means a research or teaching indicator.
Each approach brings its own ranking into being frequently inconsistent with the other rankings. For example, THE ranks the Universities of Oxford (UK) and Cambridge (UK) in the first two places, while QS ranks Massachusetts Institute of Technology (US) and Stanford University (US) at the top. The California Institute of Technology is no. 3 in THE and no. 4 in QS, but no. 193 in the Leiden Ranking (all data as of 2018; Fauzi et al., 2020, p. 89). However, Aguillo et al. (2010) found also some similarities between certain pairs of rankings (e.g., between ARWU and a ranking from Taiwan). But for most rankings, “correlations highlight the significant differences among some indexes even in measuring the same criterion such as teaching or research” (Olcay & Bulu, 2017, p. 153).
All this has led the majority of researchers to view worldwide university rankings extremely critically (Bellantuono et al., 2022; Billaut et al., 2010; Chirikov, 2023; Gadd, 2021; Kochetkov, 2024; Lim, 2018; Moed, 2017; Selten et al., 2020). For example, Altbach (2006) concludes, “they (university rankings) often measure the wrong things, and they use flawed metrics to do the measurements.” If rankings try to measure “reputation” using surveys—and such reputation indicators play an important role in the rankings of QS and THE (Hou & Jacob, 2017)—problems arise with the “reputational bias derived from the anchoring, echo, halo and Matthew effects” (Safón, 2019, p. 910). University rankings clearly exhibit shortcomings such as “adjustment for institutional size, differences between average and extreme, defining the institutions, measurement of time frame, credit allocation, excellency factors as well as adjustment for scientific fields” (Anowar et al., 2015, p. 559). In a review of articles on university rankings, Vernon et al. (2018, p. 13) conclude that “current indicators are inadequate to accurately evaluate research outcomes and should be supplemented and expanded to meet standardized criteria.” For van Raan (2005, p. 140) some university rankings can be considered as “quasi-evaluations,” which is “absolutely unacceptable.”
In view of these criticisms, the question arises as to how a meaningful ranking could be carried out at the institutional level. It is obvious that there is no universally valid research ranking. Rather, it seems more sensible to take various aspects into account in order to avoid an overly narrow view and possible misjudgments. And this is precisely where our study comes in, which on the one hand attempts to identify the dimensions (and their attributes) that affect the results of research evaluations at the institutional level, such as at the level of departments, faculties, or universities. In addition, a case study will be carried out to examine whether identical data but modified indicators and attributes lead to different rankings of two specific research institutions. If this is the case, a combined consideration of various aspects could provide a more complete picture of the research performance of the two exemplary institutions.
For resource-economic reasons, our study focuses on the research performance of institutions in the form of publications (publication output and publication impact), as we believe these are of central importance for assessing the overall performance of institutions. Therefore, we focus on the inconsistencies of rankings that make use only of quantitative scientometric data and indicators. From the literature (e.g., Reichmann & Schlögl, 2021; 2022; Reichmann et al., 2022), we identified several dimensions of research output and of research impact, which may influence the results of a quantitative research evaluation more or less strongly. “Output” (“production”) means an institution’s publications and “impact” the citations these publications attracted (Abramo, 2018; Stock, 2001; 2010).
For our case study, we focused on two university departments that we know very well (those where we are currently working or have previously worked), as this was the only way to fully capture the required data. Departments, like universities, are also located at the meso-level, and so the dimensions and attributes we identified in the first step are fully relevant.
Overall, in our study we want to answer the following two research questions (RQs):
RQ1. Based on a purely theoretical consideration: Which dimensions and which attributes of the dimensions are useful for the description and subsequent ranking of research institutions? (Section 2)
RQ2. Based on a case study of two research institutions: Is it useful to produce different rankings concerning their research output and research impact? (Sections 3 and 4)
2. DIMENSIONS OF SCIENTOMETRIC RESEARCH EVALUATION
In the following section (2.1.) we present the dimensions having an impact on the results of research evaluations in more detail (RQ1). As is e xhibited in Table 1, they differ partly depending on whether they refer to research output via publications (P) or research impact via citations (C). Concerning research output we found nine, and for research impact we identified 14 relevant dimensions. In Table 1 we list each dimension and its possible attributes to provide guidance for a “fair ranking” of institutions (Vavryčuk, 2018), if something like that is ever possible.
Table 1
Scientometric dimensions of research output and research impact and their attributes
| Dimensions | Attributes |
|---|---|
| Research output - publications | |
| P1. Time period | 1 year | multi-year periods | institution’s lifetime |
| P2. Size of the institution |
a) Size-dependent: no consideration of size b) Size-independent: production per capita | labor productivity (production per full-time equivalent) | productivity (production per complete input costs) |
| P3. Representatives of the institution | Only full professors | all professors | professors and postdocs | all faculty | all research staff |
| P4. Data source | Web of Science (WoS) | Scopus | Dimensions | Google Scholar | discipline-specific information services | combinations of information services | personal publication lists/institutional research databases |
| P5. Language | Only English | only national language | combinations of individual languages | all languages (no consideration) |
| P6. Document types and their weighting |
a) Without weighting: books | journal articles | articles in proceedings | articles in other edited books | granted patents | other publications | combinations of individual document types | all document types (all publications) b) With weighting: document-type-specific weights (single document types, combinations, all document types) | weighting with impact factor or source-normalized impact per paper (only for journal articles) | only highly-cited articles (only for journal articles) |
| P7. Co-authorship | Whole counting (micro-level=individual level) (no consideration) | whole counting (meso-level) | fractional counting (1/n) | other adjusted counting methods |
| P8. Document length | Exclusion of very short publications | weighting by page or character numbers | no consideration |
| P9. Access status | Share of full text documents online | not considering access status |
| Research impact - citations | |
| C1. Time period of citing documents (citations) | Short-term citation impact | long-term citation impact |
| C2. Time period of cited documents (publications) | See research output, dimension 1 (P1) |
| C3. Size of the institution | See dimension P2 |
| C4. Representatives of the institution | See dimension P3 |
| C5. Data source of citing documents | WoS | Scopus | Dimensions | Google Scholar | combinations of information services |
| C6. Data source of cited documents | See dimension P4 |
| C7. Language of citing documents | Only English | all languages (no consideration) |
| C8. Language of cited documents | Only English | all languages (no consideration) |
| C9. Document types and their weighting (citing documents) |
a) Without weighting: journal articles | all document types (all publications) b) With weighting: weighting with the importance of the citing article (e.g., PageRank) | weighting with the importance of the journal of the citing article (e.g., impact factor) |
| C10. Document types and their weighting (cited documents) |
a) Without weighting: journal articles | all document types (all publications) b) With weighting: document-type-specific weights | weighting with, e.g., impact factor (only journal articles) | only highly-cited articles |
| C11. Citations to co-authored publications | See dimension P7 |
| C12. Document length of cited documents | See dimension P8 |
| C13. Dealing with self-citations | Consideration of all citations (no consideration of self-citations) | weighting of self-citations | exclusion of author self-citations | exclusion of institutional self-citations |
| C14. Citations by access status of cited documents | Citations by access status of cited documents | not considering access status |
We did not consider compound indicators, which are derived from two or more raw indicators. Examples are normalization approaches for research fields, such as the Leiden crown indicator (Abramo & D’Angelo, 2016; Opthof & Leydesdorff, 2010; van Raan et al., 2010), and the H-Index combining publication and citation counts (Hirsch, 2005; 2023; Kamrani et al., 2021). We also did not consider indicators from altmetrics, e.g., mentions of an institution’s research activities on social media services (Stock et al., 2023b, pp. 46-48).
2.1. Research Output
2.1.1. (P1) Time Period
A fundamental dimension of any research evaluation is the determination of the appropriate analysis period (Ioannidis et al., 2007), which depends partly on the purpose of an evaluation. When analyzing smaller evaluation units like subunits of universities or individual researchers, it must be considered that small-term fluctuations may have some impact on the evaluation results. In their analysis, Reichmann and Schlögl (2022) show that the extent of fluctuations in the publication output of a university department can be particularly strong in the short-term.
There are many possibilities to find the best-fitting time frame. International university rankings prefer a time period of one year. Similar to the 5-year impact factor, one can work with a time frame of 5 years; also, shorter or longer multi-year periods can make sense. Finally, it is possible to describe and evaluate the entire lifetime of an institution—as did Reichmann and Schlögl (2022) or Stock (2022). Periods of less than a year seem clearly too short for a research evaluation. In addition, the data are usually only available on a yearly basis.
Regarding this dimension, we identified three advisable attributes (Table 1).
2.1.2. (P2) Size of the Institution
After having defined a proper unit of evaluation (chair, department, institute, school, or university), the extent to which its size should be considered must be fixed. There are both size-dependent (ignoring the size) and size-independent (considering the size) indicators (Anninos, 2014; Docampo & Bessoule, 2019). If evaluators apply size-independent indicators, a research evaluation on the meso-level faces the challenge of capturing the number of an institution’s staff members (employees) over the considered time period (Toutkoushian et al., 2003) as the “underlying production capability” (Thelwall & Fairclough, 2017, p. 1142). For the consideration of size, there are three different approaches in research evaluation, namely the production per capita (Abramo & D’Angelo, 2014; Akbash et al., 2021), the labor productivity, i.e. the production per full-time equivalent (FTE) (Stock et al., 2023a), and the productivity relating production to the complete input costs (Abramo et al., 2010).
When assessing research performance at the meso-level, it seems fairest to us to consider the size of the institution under consideration. Accordingly, it is quite surprising that this is not the case in many university rankings (Olcay & Bulu, 2017; van Raan, 2005). One reason for this might be that it is often quite difficult to get the relevant data on the research staff employed and their costs.
In summary, the dimension of “size of the institution” can have four attributes (Table 1).
2.1.3. (P3) Representatives of the Institution
Closely related to the size of an institution is the question of who actually represents the research staff (Bornmann & Marx, 2013). A wide definition (all research staff) would also include staff which runs the technical infrastructure; a narrower definition would only consider faculty. Considering only professors and postdocs takes into account that predocs are preliminarily concerned with their doctoral theses and, as a consequence, do not publish so much. The narrowest definition would only consider full professors, since they represent the core of the research staff. Studies have shown that full professors are more productive than other categories of professors: Abramo et al. (2011) studied the performance differences between full, associate, and assistant professors in Italy; Ventura and Mombrú (2006) published a similar study on full and associate professors in Uruguay.
All in all, we found five options to define an institution’s representatives (Table 1).
2.1.4. (P4) Data Source
The great impact of the data source on the results of a research evaluation has already been shown in many other studies (see, e.g., Harzing & Alakangas, 2016). In most evaluations, research publications are retrieved from public databases. Multidisciplinary information services such as WoS (Birkle et al., 2020; Stock & Stock, 2003), Scopus (Baas et al., 2020), Dimensions (Herzog et al., 2020), and Google Scholar (Aguillo, 2012) offer the great advantage that they also provide citation data. However, across all multidisciplinary information services, there is a pronounced unequal coverage of certain disciplines (Mongeon & Paul-Hus, 2016) and many languages (except English) (Vera-Baceta et al., 2019). Google Scholar is by far the most complete service (Martín-Martín et al., 2018). However, the use of Google Scholar for research evaluation is discussed critically in general (Halevi et al., 2017). The quality of WoS seems to be rather high, though it is far from being top. For example, Tüür-Fröhlich (2016) was able to show that there are many spelling and typing errors, “mutations” of author names, and data field confusions, all leading to wrong evaluation results.
It must also be considered that all the mentioned multidisciplinary information services are more or less incomplete (Hilbert et al., 2015). Their coverage is particularly low for most non-English languages as well as in the social sciences and humanities (Dorsch, 2017). In these cases, discipline-specific information services could be an alternative. Additionally, it is possible to merge data from different information services to get a more complete picture. However, in order to have a full coverage of research output, personal publication lists of the researchers would be necessary (Dorsch et al., 2017). An alternative would be institutional research databases which contain, among other data, the publications of the scientific staff.
Overall, there are seven alternatives concerning the selection of the data source (Table 1).
2.1.5. (P5) Language
While the publication language is primarily English in most of the natural sciences, this is different in the social sciences and humanities (Stockemer & Wigginton, 2019). Therefore, it is very useful to also retrieve publications in the national language of the institutions (Pölönen et al., 2018). Furthermore, a differentiation by publication language could be useful in order to investigate the international orientation. Such a study was, for instance, conducted by Schlögl (2013) who analyzed the international visibility of European and in particular German language information science.
We see four options for dealing with publication languages in research evaluations (Table 1).
2.1.6. (P6) Document Types and Their Weighting
Even in disciplines where scholarly communication takes place primarily in journals, an editorial or book review, for example, cannot be treated in the same way as a research article (Stock, 2001; 2010; Stock et al., 2023b). Moreover, it is possible to consider different quality levels for journal articles, for example by using the (problematic) impact factor for journal ratings (Martyn, 2005; Seglen, 1992; 1997; Van Noorden, 2010).
In the social sciences and humanities, document types are more heterogeneous than in the natural sciences. A possible rough categorization of all document types would be books, journal articles, articles in proceedings or other edited books, patents, and other types (meeting reports, project reports, etc.). In order to consider the different efforts involved in composing these publication types, it is possible to either carry out separated rankings by each document type or to assign different weights (Kladroba et al., 2021). In a rather arbitrary way, some authors have introduced different weights, for instance, 50 for a monograph, 10 for an article, and 1 for a book review (e.g., Finkenstaedt, 1986). Following a completely different idea by Abramo and D’Angelo (2015), one can restrict a ranking on counting the number of highly-cited publications by the institution’s employees using data from WoS or Scopus.
Concerning document types and their weightings, we would at least consider the following eleven options, a) eight of them without weighting and b) three of them with weighting (Table 1).
2.1.7. (P7) Co-Authorship
How can publications with more than one author (Gauffriau, 2017) be dealt with? Whole counting, meaning to count “1” for each of the co-authors, is still a common way to treat co-authored work (Sivertsen et al., 2019). However, it does not reflect the real contribution of an author. If we aggregate data from the individual researcher level (micro-level) to higher levels (meso- and macro-levels), whole counting may lead to a serious statistical problem: If two authors from the same institution co-publish an article, this article would be counted as 2 for the institution (Schloegl et al., 2022; Stock et al., 2023b). Since co-authorship by researchers from the same institution is always possible, the addition of the individual values would lead to values that are too high at the aggregation level. This error can be avoided by relating whole counting directly to the aggregation level, i.e., the meso-level (Reichmann & Schlögl, 2021).
A fairer approach for attributing research effort to an individual author or to a university department is adjusted counting, for which there are different possibilities. According to the most common formula 1/n (Waltman, 2016, pp. 378 ff.), each of the n co-authors receives the same share for a publication. The fact that co-authored publications require additional coordination and discussion is better expressed by the formula 2/(n+1) (Schneijderberg, 2017, p. 343). All in all, Gauffriau (2021) identified 32 different counting methods for an author’s share of a multi-authored research publication. One disadvantage of adjusted counting is that in a few disciplines it is common to list all persons who were somehow involved in the creation of a publication; sometimes even some hundreds of co-authors are mentioned. As a consequence, the individual share of each co-author is very small. It is precisely in these cases that it would be desirable for each author’s contribution to be stated as it really was (Rahman et al., 2017).
We can distinguish four approaches for treating co-authorships (Table 1).
2.1.8. (P8) Document Length
To some degree the length of the publications can also be considered in a research evaluation. However, the following issues must be regarded: Papers can be very long (e.g., more than 50 or even 100 pages) or very short (e.g., letters with a length less than one page of the journal Science), and this may be completely independent of the quality of the documents. When using page numbers, the length of publications can vary greatly depending on different aspects such as layout or font size. An alternative could be to count single characters. When considering the document length at all, it is even more problematic if different document types (e.g., books and proceedings papers) are involved. But most importantly, there is hardly any correlation between quantity and quality. Possibly, if at all, it is therefore primarily useful to use the length of a publication as a filter criterion (e.g., only publications with at least 500 or 1,000 words are taken into account). However, also this can be problematic as well since some high-quality journals like Science and Nature actually publish very short articles.
With regard to the length of publications, we ultimately differentiate between three variants (Table 1).
2.1.9. (P9) Access Status
It is known for decades that research articles published online in their full lengths – maybe as open access documents or otherwise – have the chance to gather higher visibility and even higher citation counts, compared with articles in which only the bibliographic data are known, e.g., articles behind a paywall (Gargouri et al., 2010). Wentz (2002) called this effect the Full Text On the Net bias.
In evaluative scientometrics we can recognize this effect and differentiate between the number of full-text articles and non-full-text articles, or ignore it (Table 1).
2.2. Research Impact
Besides the nine dimensions of research output, 14 dimensions concerning citing and cited documents have an influence on an institution’s research impact.
2.2.1. (C1) Time Period of Citing Documents
The chosen time period is also important with regard to citations (Wang, 2013). Short-term citation impact indicators (e.g., considering the last two years in analogy to the impact factor) do not work well, especially in research fields with a long citation history such as history and philology. Since in other fields it takes also some time until citations evolve, long-term citation impact provides a more meaningful description (Wang & Zhang, 2020). Regarding this dimension, we have identified two attributes (Table 1).
2.2.2. (C2) Time Period of Cited Documents
In the context of a citation analysis, the period of the publications whose citations are relevant must be determined in addition to the period of the citations (see dimension P1).
2.2.3. (C3) Size of the Institution
Here, we refer to the explanations on dimension P2. The only difference is that the size-independent attributes refer to citations instead of publications (e.g., impact per FTE instead of production per FTE).
2.2.5. (C5) Data Source of Citing Documents
In contrast to the use of the data source for publication counts, for citations we can only apply information services that provide citations, such as WoS, Scopus, Dimensions, or Google Scholar. Therefore, many field-specific databases and personal as well as institutional publication lists drop out and only five variants remain (Table 1).
2.2.6. (C6) Data Source of Cited Documents
Theoretically, in the context of a citation analysis, one could refer to publications contained in any data source (see dimension P4) and then retrieve the citations for that subset of documents which is also included in the citations database. In practice, however, the same database (e.g., WoS) is usually used for retrieving the publications and the citations to them.
2.2.7. (C7) Language of Citing Documents
Since the citation databases currently available are largely limited to English-language sources, only two variants make sense from our point of view (Table 1).
2.2.8. (C8) Language of Cited Documents
In some rare cases, it could be of interest to differentiate between the publication language of the citing and the cited documents. In contrast to the publication analysis, we consider only two variants (the same as in C7) for the language of the cited documents to be useful in the context of a citation analysis (Table 1).
2.2.9. (C9) Document Types and Their Weighting (Citing Documents)
Since citation databases more frequently contain articles in journals, in contrast to the publication analysis, we would only differentiate between two variants with regard to the document types: journal articles and all publications.
When counting the citations of an institution’s publications, one can count every citing article equally with 1. If not all citing sources are of similar quality, one can weight a citation according to the importance of the citing publication. It might be critical to work with, e.g., the journal impact factor of a citing article, as this is the same dead end as when weighting an individual article with the journal’s impact factor. A more suited approach is weighting with the importance of the citing article through the use of network analysis. Many scientometric studies work with PageRank-like measures (Brin & Page, 1998) or similar eigenvector-based calculations of the citing documents (Cai et al., 2019).
Finally, we can distinguish between four attributes for this dimension, a) two without weighting and b) two with weighting (Table 1).
2.2.10. (C10) Document Types and Their Weighting (Cited Documents)
The discussion on dimension P6 applies here with the following deviation: Regarding the dominance of journal articles in citation databases, a restriction to only two document types seems to be useful: journal articles and all document types. Since a weighting of the cited documents could also be of interest in a few cases, we would suggest a total of five attributes for this dimension, a) two without weighting and b) three with weighting (Table 1).
2.2.11. (C11) Citations of Co-Authored Publications
Citations of publications with more than one author can be counted as 1 for each co-author of the cited publication (whole citation counting) or in analogy to fractional counting of publications, as 1/n for each co-author (fractional citation counting) (Leydesdorff & Shin, 2011)—or using any other counting method described by Gauffriau (2021). As a consequence, there remain the same variants as for dimension P7.
2.2.13. (C13) Dealing with Self-Citations
Self-citations play a special role in research evaluation, as researchers can inflate their citation rate through massive self-citations, both at the author level (author self-citations) and at the institutional level (citations from other authors of the same institution). It is not useful to ignore self-citation, as it may be very informative when an author uses his or her own insights in a later publication. Accordingly, self-citations may signal continuity and competence in a particular research field. However, external citations may be more relevant for evaluation purposes (Costas et al., 2010). Schubert et al. (2006, p. 505) introduced weightings for self-citations. Accordingly, a self-citation link between two single-authored papers by the same author is “stronger” than one between two multi-authored papers in which the former is cited by a joint co-author. From the above, four approaches can be distinguished (Table 1).
2.2.14. (C14) Citations by Access Status of Cited Documents
In continuation of dimension P9 we differentiate twofoldly concerning the description of the access status of the cited documents (Table 1).
At this point we can answer our first RQ: Relating the attributes of all dimensions to each other accounts for about 440,000 theoretically possible publication rankings, and for more than 32 million citation rankings. Exactly, there are 443,520 possible publication rankings which result from the following multiplication (the factors represent the number of attributes of each dimension): 3×4×5×7×4×11×4×3×2. The 32,256,000 possible citation rankings are calculated as follows: 2×3×4×5×5×7×2×2×4×5×4×3×4×2. Definitely, many of these rankings do not make sense. However, there are also many suitable rankings, each of which stresses particular aspects more or less strongly. If university rankings such as ARWU and THE have chosen any dimensions and any attributes for their rankings without evidence-based justifications, their ranking methods will seem rather arbitrary.
3. CASE STUDY METHODOLOGY
Based on our second RQ, we want to investigate what impact follows on research performance if we vary some attributes of the scientometric dimensions discussed before. In order to do this, we are following a case study approach and compare the research performance of two similar information science departments: the Department of Information Science at the University of Düsseldorf, which was part of the Institute of Language and Information, and the former Department of Information Science and Information Systems at the University of Graz. The main reason for the selection of these two research institutions was that they are comparable to some degree. Partly they do research on similar topics, in particular scientometrics and information literacy, and partly they work in different research areas: Düsseldorf on smart cities and social media services, and Graz on topics related to information systems. Another reason was that the authors were staff members of the two institutions, which facilitated both data collection and interpretation of the results.
One major difference between the two organizational units relates to the staff structure. While the department in Düsseldorf consisted of one professor and more than ten predocs and postdocs, the department in Graz had one full and three associate professors as well as one predoc researcher. As a consequence, the department in Düsseldorf had slightly more than two times the research staff compared to that in Graz. The department in Düsseldorf is shut since the beginning of 2024, while that in Graz was merged with two other departments in 2020, forming the Department of Operations and Information Systems. Due to data availability, we chose an evaluation period from 2009 to 2018 (i.e., 10 years). Publication data was collected for all research staff employed (at some point of time) between 2009 and 2018. It should be noted that obtaining the appropriately detailed employment data took some effort. This shows how difficult it is, even for relatively small research units, to determine the research output per FTE, in particular for longer evaluation periods.
For Düsseldorf, the data of all personal publication lists was cumulated. For Graz, there exists an institutional research database in which researchers have to enter their research activities, including their publications. All publication data was entered into a MS Access database (Microsoft, Redmond, WA, USA) developed for this study. Besides the most important bibliographic data, the number of co-authors, the publication type (books, journal articles, articles in proceedings, articles in other edited books, and other publications), the publication language, and the length (in pages) were also recorded for each publication. Finally, we recorded whether a publication was included in WoS Core Collection (without consideration of the Book and the Proceedings Citation Index), Scopus, or Google Scholar, and how often it was cited in these databases. Data collection took place in December 2020 for WoS and in March 2021 for Scopus and Google Scholar. The Access database comprises a total of 345 publications by authors from Düsseldorf and 228 publications by authors from Graz. Fig. 1 shows the publication output during the observation period by document type for Düsseldorf and Graz.
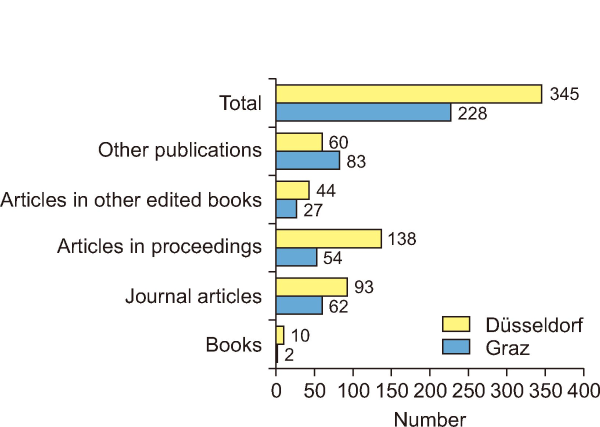
As can be seen, journal articles constitute only slightly more than one quarter of the total publication output at both institutions. Therefore, we decided not to base our publication analyses solely on journal articles (dimension P6). Variant 1 covers all document types, which were arbitrarily weighted as follows: books – 10 points, journal articles – 5 points, articles in proceedings – 3 points, articles in other edited books – 2 points, other publications – 1 point. Variant 2 only considers journal articles. This means that in variant 2 there is no weighting of publication types. For each of these two variants, we used the following attributes for the various dimensions to calculate the so-called base of operations:
-
Time period: multi-year period, namely 10 years (2009-2018) (dimension P1).
-
Size of the institution: size-dependent (ignoring the size) and size-independent using labor productivity (production per FTE) (dimension P2). Since we believe that this dimension is a key influencing factor on the results of research evaluations on the meso-level, all of the following variations are always calculated and presented in a size-dependent and a size-independent manner.
-
Representatives of the institution: all research staff (dimension P3).
-
Data source: personal publication lists (Düsseldorf) / institutional research database (Graz) (dimension P4).
-
Language: all languages (dimension P5).
-
Document types and their weighting: variant 1: all document types, using document-type-specific weights (see above); variant 2: journal articles without weighting (dimension P6).
-
Co-authorship: fractional counting (1/n given n co-authors) (dimension P7).
-
Document length: no consideration (dimension P8).
-
Access status: not considered (dimension P9).
Starting from the base of operations, we then calculated alternative research rankings (in our case study, they consisted only of a comparison of the values for the two compared institutions), in which only one attribute of one dimension was changed compared to the base of operations (e.g., dimension P4 – data source: WoS instead of personal publication lists/institutional research database). In this way, we calculated 12 (9) alternatives with regard to variant 1 (2), the results of which are displayed in the following two tables, both size-dependent and size-independent. Each of the tables also shows for each ranking by what percentage Düsseldorf is better or worse than Graz (Graz=100% in each case).
We chose the same procedure for the citation analysis as for the publication analysis, i.e., there are variants 1 and 2 with regard to the cited documents (dimension C10: all document types without weighting vs. journal articles), as well as a size-dependent and a size-independent presentation of the results (dimension C3). For both variants, we again calculated a base of operations, on the basis of which we then calculated seven alternatives according to the procedure described regarding the publication analysis. We used the following attributes for the various dimensions to calculate the base of operations for the citation analysis:
-
Time period of citing documents: long-term citation impact, namely 2009-2020/2021 (dimension C1).
-
Time period of cited documents: multi-year period, namely 10 years (2009-2018) (dimension C2).
-
Size of the institution: size-dependent (ignoring the size) and size-independent using labor productivity (impact per FTE) (dimension C3).
-
Representatives of the institution: all research staff (dimension C4).
-
Data source of citing documents: WoS Core Collection (dimension C5).
-
Data source of cited documents: personal publication lists (Düsseldorf) / institutional research database (Graz) (dimension C6).
-
Language of citing documents: all languages (dimension C7).
-
Language of cited documents: all languages (dimension C8).
-
Document types and their weighting (citing documents): all document types without weighting (dimension C9).
-
Document types and their weighting (cited documents): variant 1: all document types without weighting; variant 2: journal articles without weighting (dimension C10).
-
Citations of co-authored papers: fractional counting (1/n) (dimension C11).
-
Document length of cited documents: no consideration (dimension C12).
-
Dealing with self-citations: consideration of all citations (dimension C13).
-
Access status of cited documents: no consideration (dimension C14).
4. CASE STUDY RESULTS
4.1. Publication Analysis
Tables 2 and 3, which are related to the publication analysis, reveal that Düsseldorf performs significantly better in nearly all size-dependent indicators. The simple reason is that Düsseldorf has more than twice the research staff of Graz (11.32 vs. 5.125 FTE). Graz solely comes first if the professors are seen as the representatives of an institution (variation 3). Since Graz has 4 professors and Düsseldorf only 1, it is not surprising that the total publication output of Graz is higher than that of Düsseldorf in this ranking.
Table 2
Rankings of the two institutions – effects of changing attributes in a publication analysis – variant 1 (all document types)
| Variations of single attributes | Total publications (points)a) (dim. P2) | ∆ (%) | Publications (points)a) per FTEb) (dim. P2) | ∆ (%) | ||
|---|---|---|---|---|---|---|
| Graz | Düsseldorf | Graz | Düsseldorf | |||
| 1. Base of operationsc) | 461.2 | 896.5 | 94 | 90.0 | 79.2 | -12 |
| 2. Dim. P1: 2014-2018 | 167.8 | 475.4 | 183 | 32.7 | 42.0 | 28 |
| 3. Dim. P3: only all professorsd) | 346.7 | 193.2 | -44 | 86.7 | 193.2 | 123 |
| 4. Dim. P4: WoS | 65.1 | 160.7 | 147 | 12.7 | 14.2 | 12 |
| 5. Dim. P4: Scopus | 141.3 | 439.7 | 211 | 27.6 | 38.8 | 41 |
| 6. Dim. P4: Google Scholar | 299.0 | 763.7 | 155 | 58.3 | 67.5 | 16 |
| 7. Dim. P5: only English publications | 202.1 | 581.1 | 188 | 39.4 | 51.3 | 30 |
| 8. Dim. P6: without other publications | 388.7 | 841.0 | 116 | 75.8 | 74.3 | -2 |
| 9. Dim. P6: only articles in proceedings | 102.7 | 306.2 | 198 | 20.0 | 27.1 | 35 |
| 10. Dim. P6: different weightinge) | 391.4 | 752.4 | 92 | 76.4 | 66.5 | -13 |
| 11. Dim. P7: co-authorship: 2/(1+n) | 538.0 | 1,159.6 | 116 | 105.0 | 102.4 | -2 |
| 12. Dim. P7: full counting | 656.0 | 1,171.0 | 79 | 128.0 | 103.5 | -19 |
| 13. Dim. P8: publication length ≥5 pages | 370.8 | 740.6 | 100 | 72.4 | 65.4 | -10 |
a)The figures in the table are not publication numbers but publication points (see dim. P6); book=10, journal article=5, article in proceedings=3, article in other edited book=2, other publication=1. b)Graz: 5.125 FTE, Düsseldorf: 11.32 FTE. c)Dim. P1: 2009-2018; dim. P3: all research staff; dim. P4: publication lists/inst. research database; dim. P5: all languages; dim. P6: weighting: book=10, journal article=5, article in proceedings=3, article in other edited book=2, other publication=1; dim P7: 1/n; dim. P8: no consideration of document length – see section 3, variant 1. d)Graz: 4 professors, Düsseldorf: 1 professor. e)Weighting: book=5, journal article=4, article in proceedings=3, article in other edited book=2, other publication=1.
Since in our view the consideration of the institution’s size is much fairer, we only refer to size-independent indicators (dimension P2, see right-hand parts of Tables 2, 3) in the following discussions. In variant 1 (dimension P6), which includes all document types, Graz is ahead in six cases and Düsseldorf in seven cases. According to the base of operations, a researcher from Graz achieves an average of 90 (publication) points, while a researcher from Düsseldorf only achieves 79.2 points. Here, Düsseldorf is 12% behind Graz.
Table 3
Ranking of the two institutions – effects of changing attributes in a publication analysis – variant 2 (only journal articles)
| Variations of single attributes | Total journal articles (dim. P2) | ∆ (%) | Journal articles per FTEa) (dim. P2) | ∆ (%) | ||
|---|---|---|---|---|---|---|
| Graz | Düsseldorf | Graz | Düsseldorf | |||
| 1. Base of operationsb) | 40.3 | 70.0 | 74 | 7.9 | 6.2 | -21 |
| 2. Dim. P1: 2014-2018 | 14.8 | 40.6 | 174 | 2.9 | 3.6 | 24 |
| 3. Dim. P3: only all professorsc) | 28.1 | 20.0 | -29 | 7.0 | 20.0 | 185 |
| 4. Dim. P4: WoS | 12.3 | 31.0 | 152 | 2.4 | 2.7 | 14 |
| 5. Dim. P4: Scopus | 17.0 | 47.7 | 181 | 3.3 | 4.2 | 27 |
| 6. Dim. P4: Google Scholar | 33.2 | 63.3 | 91 | 6.5 | 5.6 | -14 |
| 7. Dim. P5: only English papers | 13.9 | 38.4 | 176 | 2.7 | 3.4 | 25 |
| 8. Dim. P7: co-authorship: 2/(1+n) | 48.6 | 88.6 | 82 | 9.5 | 7.8 | -17 |
| 9. Dim. P7: full counting | 62.0 | 93.0 | 50 | 12.1 | 8.2 | -32 |
| 10. Dim. P8: paper length ≥5 pages | 39.3 | 61.7 | 57 | 7.7 | 5.5 | -29 |
a)Graz: 5.125 FTE, Düsseldorf: 11.32 FTE. b)Dim. P1: 2009-2018; dim. P3: all research staff; dim. P4: publication lists/inst. research database; dim. P5: all languages; dim. P6: journal articles; dim. P7: 1/n; dim. P8: no consideration of document length. c)Graz: 4 professors, Düsseldorf: 1 professor.
As Table 2 shows, each attribute has a greater or lesser impact on the research output of the two institutions. Interestingly, Düsseldorf is 28% ahead if only the research output of the last 5 years of the observation period (variation 2) is considered, which results in a difference of 40%-points compared to the base of operations with an observation period of 10 years. In fact, from 2014 to 2018 Graz only achieved slightly more than one third of its whole research output per FTE (based on 2009 to 2018), with Düsseldorf reaching slightly more than half.
As can be seen in Fig. 1, the structure of the publication output differs between Graz and Düsseldorf. This is reflected in the rankings based on different document types and their weighting (variations 8-10). For instance, Düsseldorf has published more books and 35% more articles in proceedings per FTE but fewer other publications. Without taking the latter into account, the research performance of Graz is only slightly above that of Düsseldorf (variation 8). If only articles in conference proceedings are taken into account, Düsseldorf performs significantly better than Graz (variation 9). The structure of the publication output is, of course, also reflected in the weightings. If a different weighting is used in which books are weighted less (variation 10: weighting factor 5 for books instead of 10), Düsseldorf performs slightly worse compared to the base of operations (-13% vs. -12%).
In contrast to the researchers from Düsseldorf, the researchers from Graz have a high proportion of German-language publications (56% vs. 37%). Therefore, if only English-language publications are considered (variation 7), Düsseldorf is 30% ahead of Graz. Document type and language also have a great impact on coverage in various data sources (variations 4-6). According to Table 2, Düsseldorf has a significantly higher publication output than Graz based on the three information services considered: WoS (+12%), Scopus (+41%), and Google Scholar (+16%). The high values of Düsseldorf’s institution on Scopus are also due to the high number of articles in proceedings, which are not included in the subscriptions of WoS by the university libraries of Düsseldorf and Graz.
When considering only articles with a length of at least 5 pages (variation 13), Düsseldorf has a 10% lower research output than Graz. The (small) difference to the base of operations is due to the fact that Graz has a higher proportion of other publications, which are usually relatively short. If the ranking is based on full counting (variation 12), the lead of Graz is greater compared to the base of operations: Düsseldorf is 19% behind Graz here. This is due to different collaboration habits. Accordingly, the fractional publication counts are usually higher for Düsseldorf than for Graz since Düsseldorf has a higher amount of internal co-authorships. In the case of a higher weighting of a larger number of co-authors, as is the case with the formula 2/(n+1) (variation 11), Düsseldorf is preferred even more and is then only 2% behind Graz.
Not only do the above-mentioned collaboration habits differ, but the structure of the research staff also differs between the two institutions. Düsseldorf has one professor and several pre- and postdocs (some of them employed in projects), whereas in Graz the research staff consists of four professors and one predoc. So, if only the research output of the professors is taken into account (variation 3), the absolute value for Graz is significantly higher. When relating the research output to one FTE, Düsseldorf is clearly ahead (+123%), as the professor from Düsseldorf has a very high research output. However, this is partly also due to joint work with other Düsseldorf research staff members.
In variant 2, only journal articles are considered (dimension P6), which account for a little more than one quarter of the publications at the two institutions. Here, Graz and Düsseldorf head the rankings per FTE in five cases each. As is shown in Table 3, one FTE from Graz published an average of 7.9 journal articles, and one FTE from Düsseldorf published 6.2 journal articles according to the base of operations. Here the difference of 21% is significantly higher than in variant 1 since Graz has a higher proportion of journal articles than Düsseldorf. The variations of the attributes lead to similar results as in variant 1 – with a few exceptions: One is that more journal articles from Graz can be found in Google Scholar than from Düsseldorf (variation 6). This might be due to the fact that more German-language journals are indexed in Google Scholar compared to WoS and Scopus, and because many journal articles from Graz are in German (see variation 7). Furthermore, Graz has a higher proportion of journal articles with a length of at least five pages (variation 10). The lower percentage differences in favor of Düsseldorf when using Scopus (variation 5) compared to variant 1 can be explained by the fact that books and articles in proceedings (where Düsseldorf has a lead over Graz) are not considered in variant 2.
4.2. Citation Analysis
When considering citations, Düsseldorf is clearly ahead in all rankings. As before, we differentiated between two kinds of rankings: one in which citations to all document types were covered (variant 1 – Table 4) and one in which citations to only journal articles were regarded (dimension C10) (variant 2 – Table 5). The comparison of the two variants shows that the citation numbers between the two variants are relatively close with regard to the WoS-based rankings. This is due to the fact that the used WoS Core Collection is predominantly based on journal publications. When comparing the base of operations of the two variants, Düsseldorf receives approximately double as many citations (+102% for variant 1, +80% for variant 2). These values are similar if only English language publications are considered (variation 4), which is why WoS considers primarily English language journals.
Table 4
Ranking of the two institutions – effects of changing attributes in a citation analysis – variant 1 (cited documents: all document types)
| Variations of single attributes | Total citations (dim. C3) | ∆ (%) | Citations per FTEa) (dim. C3) | ∆ (%) | ||
|---|---|---|---|---|---|---|
| Graz | Düsseldorf | Graz | Düsseldorf | |||
| 1. Base of operationsb) | 86.0 | 384.0 | 347 | 16.8 | 33.9 | 102 |
| 2. Dim. C2: 2014-2018 (dim. 1: 2014-2020) | 22.0 | 156.4 | 652 | 4.3 | 14.6 | 240 |
| 3. Dim. C1: 2022c) | 5.1 | 36.2 | 710 | 1.0 | 3.2 | 320 |
| 4. Dim. C8: only English cited documents | 79.6 | 369.0 | 364 | 15.5 | 32.6 | 110 |
| 5. Dim. C11: full counting | 204.0 | 705.0 | 246 | 39.8 | 62.3 | 56 |
| 6. Dim. C5: Scopus (dim. C1: 2004-2021) | 131.0 | 928.2 | 609 | 25.6 | 82.0 | 221 |
| 7. Dim. C5: Google Scholar (dim. C1: 2004-2021) | 468.5 | 3,471.5 | 641 | 91.4 | 306.7 | 236 |
| 8. #6+Dim. C8: German cited documents | 90.3 | 286.8 | 218 | 17.6 | 25.3 | 44 |
Citations were retrieved in December 2020 for WoS and in March 2021 for Scopus and Google Scholar.
a)Graz: 5.125 FTE, Düsseldorf: 11.32 FTE. b) Dim. C1: 2009-2020/21; dim. C2: 2009-2018; dim. C4: all research staff; dim. C5: WOS; dim. C6: publication lists/inst. research database; dim. C7: all languages; dim. C8: all languages; dim. C9: all doc. types without weighting; dim. C10: all doc. types without weighting; dim. C11: 1/n; dim. C12: -; dim. C13: all citations. c)The citations in 2022 were retrieved end of February 2023.
Table 5
Ranking of the two institutions – effects of changing attributes in a citation analysis – variant 2 (cited documents: only journal articles)
| Variations of single attributes | Total citations (dim. C3) | ∆ (%) | Citations per FTEa) (dim. C3) | ∆ (%) | ||
|---|---|---|---|---|---|---|
| Graz | Düsseldorf | Graz | Düsseldorf | |||
| 1. Base of operationsb) | 86.0 | 341.3 | 297 | 16.8 | 30.2 | 80 |
| 2. Dim. C2: 2014-2018 (dim. C1: 2014-2020) | 22.0 | 121.7 | 453 | 4.3 | 10.8 | 150 |
| 3. Dim. C1: 2022c) | 5.1 | 32.2 | 631 | 1.0 | 2.8 | 280 |
| 4. Dim. C8: only English cited documents | 79.6 | 326.3 | 310 | 15.5 | 28.8 | 86 |
| 5. Dim. C11: full counting | 204.0 | 570.0 | 179 | 39.8 | 50.4 | 27 |
| 6. Dim. C5: Scopus (dim. 1: 2004-2021) | 99.7 | 513.4 | 415 | 19.5 | 45.4 | 133 |
| 7. Dim. C5: Google Scholar (dim. 1: 2004-2021) | 272.2 | 1291.9 | 375 | 53.1 | 114.1 | 115 |
| 8. #6+Dim. C8: German cited documents | 46.8 | 145.5 | 211 | 9.1 | 12.9 | 41 |
Citations were retrieved in December 2020 for WoS and in March 2021 for Scopus and Google Scholar.
a)Graz: 5.125 FTE, Düsseldorf: 11.32 FTE. b) Dim. C1: 2009-2020/21; dim. C2: 2009-2018; dim. C4: all research staff; dim. C5: WOS; dim. C6: publication lists/inst. research database; dim. C7: all languages; dim. C8: all languages; dim. C9: all doc. types without weighting; dim. C10: journal articles without weighting; dim. C11: 1/n; dim. C12: -; dim. C13: all citations. c) The citations in 2022 were retrieved end of February 2023.
The difference is clearly greater if a shorter time window is chosen for the cited documents (variation 2; 2014-2018). Here the lead of Düsseldorf over Graz is +240% for variant 1 and +150% for variant 2. Düsseldorf has not only a higher publication output in the second half of the observation period, but its publications are also much more cited recently. This is also confirmed by variation 3 where only citations from the year 2022 are considered (+320% more citations for variant 1 and +280% more for variant 2). When full counting is used (which is common practice; see variation 5), the gap between Düsseldorf and Graz is not that large anymore: +56% for variant 1 (62.3 vs. 39.8 cites per FTE) and +27% for variant 2 (50.4 vs. 39.8 cites per FTE). Rather sizeable differences between Düsseldorf and Graz occur for Scopus (+221%; see variation 6) and Google Scholar (+236%; see variation 7) with regard to variant 1. When only German-language publications are taken into account in Google Scholar (variation 8), the lead of Düsseldorf is much smaller: slightly more than 40% for both variants. Though Graz publishes more in German, its publications are less cited compared to Düsseldorf.
5. DISCUSSION AND CONCLUSION
Our first RQ tried to identify the dimensions which have an impact on the results of research evaluations at the institutional level. Since each of the identified dimensions consists of several attributes, there are hundreds of thousands (regarding publications) or even millions (regarding citations) of possible combinations to rank institutions. Definitely, many of these combinations do not make sense. However, a greater number of them can be relevant in research evaluations.
In practice, when evaluating research institutions, for example in the context of university rankings, only a fraction of these variants can of course be used. However, some variants are used that we would never recommend for reasons of fairness (Anowar et al., 2015; Fauzi et al., 2020; Moed, 2017). For example, many international university rankings are entirely size-dependent or use only individual size-independent indicators. This is probably primarily because in many cases it could be difficult to obtain reliable data on size. If, as in our case, a study is restricted to the area of research, the average number of researchers at a university during the observation period would be needed; ideally in the form of FTE. As our study has shown, obtaining this data is already quite complex for two departments. But international university rankings usually refer to an observation period of just one year (Selten et al., 2020), which in turn makes it much easier to collect size-relevant data, as a single data collection point seems sufficient (all relevant data, such as the number of employees, are only shown on an annual basis anyway), which is why we strongly recommend collecting and taking such data into account as part of research evaluation at the institutional level.
In our study, we chose a ten-year observation period due to possible annual fluctuations in the publication output of individual researchers, as we only considered a relatively small number of researchers due to the restriction to two departments. Due to the much larger number of researchers at entire universities, annual fluctuations in performance by individual researchers should not play a role in university rankings even when looking at the data on an annual basis.
Another dimension that, in our view, is often not given enough attention in international university rankings is the handling of multiple authorships. Full counting is often used with regard to publication output, and this is even the standard in terms of research impact. This seems rather unfair to us, as it puts single authorships at a great disadvantage. However, it should be stressed that the use of fractional counting would mean a considerable additional effort. In the case of fractional counting, we would recommend using the formula 1/n, which is also the most important in practice, as our literature study has shown (see Section 2).
Based on the second RQ, we wanted to explore whether modified indicators and attributes lead to different rankings and how large the differences in the rankings can be. Hence, we have selected several combinations from the options elaborated theoretically (see Section 2) that we consider useful for research evaluation at the meso-level. As the results show, the rankings can vary greatly.
In addition to the two dimensions already mentioned above (size of the institution and handling of co-authorship), the following dimensions also had a major influence on the results of our case study: a) the representatives, whereby we recommend that the entire research staff should be taken into account in a research evaluation. This is the only way to capture the entire research performance of an institution; and b) the data source, whereby the use of personal publication lists or institutional research databases would be optimal for reasons of completeness. However, such data sources sometimes do not even exist and their use in the context of international university rankings would be extremely complex. In practice, such rankings usually rely on a single one of the common information services (Billaut et al., 2010), which can lead to considerable distortions, as our case study has shown. It would therefore be desirable if these information services were used in combination. One consequence of using these information services as a data source is that the attributes with regard to the dimensions “language” and “document types” are practically fixed, since these information services mainly contain papers in English.
Table 6 summarizes the largest differences depending on the chosen procedure (attributes). As can be seen from our case study, Düsseldorf is clearly ahead in all citation rankings, while the results of the publication rankings are more diverse. Depending on the particular underlying “research reality,” the selection of a certain attribute of a research dimension is in favor of either the one or the other department.
Table 6
Dimensions and their attributes having a strong impact on size-independent research rankings either in favor of Graz or Düsseldorf
| Relevant dimension (in favor of Graz) | Relevant attributes (in favor of Düsseldorf) | |
|---|---|---|
| Publication rankings | ||
| Time period (dim. P1) | 2009-2013 | 2014-2018 |
| Representatives of the institution (dim. P3) | All research staff | Professorsa) |
| Data source (dim. P4) | Publication lists/institutional research database | WoS, Scopusa), Google Scholar |
| Language of publications (dim. P5) | German | English |
| Document types and their weighting (dim. P6) | Higher weights for “journal articles” and “other pubs” | Higher weights for “books” and “articles in proceedings” |
| Co-authorship (dim. P7) | Full counting | Fractional counting: 1/n, 2/(n+1) |
| Document length (dim. P8) | Journal articles ≥5 pages | |
| Citation rankings | ||
| Time period of citing documents (dim. C1) |
2014-2020/21a) 2022a) |
|
| Time period of cited documents (dim. C2) | 2014-2018 | |
| Data sources of citing documents (dim. C5) | Scopusa) and Google Scholara) | |
| Document types of cited documents (dim. C10) | All document types | |
| Citations to co-authored publications (dim. C11) | Fractional counting: 1/n | |
The large differences between the results of the publication analysis and those of the citation analysis revealed in our case study illustrate the great importance of using both analyses together. In our view, too much emphasis is often placed on citation analyses in international university rankings (Baty, 2013; Huang, 2012). This is critical because, due to the limited data sources for citation analyses, there is little scope for design with regard to other dimensions, such as language.
However, the results of our case study also show that an institution that is significantly better in one area, such as Düsseldorf in terms of citations, performs better in all related rankings, regardless of which (somewhat meaningful) attributes are used. This seems very reassuring to us with regard to the selection of these attributes.
One major limitation of our case study is that it lacks generalization. Therefore, it cannot be taken for granted that other studies also reveal similarly significant differences in their rankings – or even greater differences. Overall, we assume that the variability of the rankings does not only depend on the particular circumstances of the institutions under consideration (for instance, more project staff vs. more long-term employed staff) but also on the discipline. In some natural sciences disciplines it might, for instance, be sufficient to concentrate on journal articles and citations to them. In contrast, in many social sciences and humanities disciplines this would be a much too narrow view, as is also confirmed in our case study. Here, it definitely makes sense to follow a broader approach. However, it must be pointed out that if an institution designated for a research evaluation is invited to participate in the determination of the indicators, it could be “attempted” to suggest those dimensions and attributes which are in favor of it.
Scientometric indicators are not “good” or “bad” per se. However, as our case study shows, a wise use of different indicators can reflect research reality much more adequately. Therefore, rankings of institutions such as the rankings of the world’s universities with only one composite indicator are in no way purposeful. As there are numerous possible combinations of quantitative dimensions and their attributes, there is never a “true” measurement and all indicator selection is more or less arbitrary.
Therefore, all mentioned rankings of universities are suboptimal. The research literature on global rankings of universities is very critical. But the producers of the rankings have failed to adjust their methods. After all, if the publishing institutions insist on producing their rankings in the future, following the literature and the results of our study, we have some serious recommendations:
-
Justify your indicators! Tell your customers why you choose some indicators and ignore others! Our list of dimensions and their possible attributes may be helpful.
-
Consider the university’s size! It is by no means fair to compare a small higher education institution with a university with many researchers, institutes, and larger budgets.
-
Justify your selection of authors (all staff, only full professors, with or without postdocs, etc.)!
-
Use fractional publication and citation counting (1/n given n co-authors)! As it is more and more common to work in teams leading to enhanced co-authorships, whole counting (counting all authors as “1”) is both statistically problematic and unrealistic.
-
Try to compile a complete list of publications of all mentioned universities! Relying only on WoS, Scopus, or Dimensions is a great jeopardy as all multidisciplinary bibliographic information services are biased and incomplete. It would be better to try to find personal or institutional publication lists in addition.
If evaluators fail to follow these hints because the necessary activities are too complex or too costly to realize, the Austrian philosopher Wittgenstein (n.d., ch. 7) should be remembered: “Whereof one cannot speak thereof one must be silent.”
REFERENCES
(2018) Revisiting the scientometric conceptualization of impact and its measurement Journal of Informetrics, 12, 590-597 https://doi.org/10.1016/j.joi.2018.05.001.
, (2014) How do you define and measure research productivity? Scientometrics, 101, 1129-1144 https://doi.org/10.1007/s11192-014-1269-8.
, (2015) Ranking research institutions by the number of highly-cited articles per scientist Journal of Informetrics, 9, 915-923 https://doi.org/10.1016/j.joi.2015.09.001.
, (2016) A farewell to the MNCS and like size-independent indicators Journal of Informetrics, 10, 646-651 https://doi.org/10.1016/j.joi.2016.04.006.
, , (2011) Research productivity: Are higher academic ranks more productive than lower ones? Scientometrics, 88, 915-928 https://doi.org/10.1007/s11192-011-0426-6.
, , (2010) National research assessment exercises: A measure of the distortion of performance rankings when labor input is treated as uniform Scientometrics, 84, 605-619 https://doi.org/10.1007/s11192-010-0164-1.
(2012) Is Google Scholar useful for bibliometrics? A webometric analysis Scientometrics, 91, 343-351 https://doi.org/10.1007/s11192-011-0582-8.
, , , (2010) Comparing university rankings Scientometrics, 85, 243-256 https://doi.org/10.1007/s11192-010-0190-z.
, , (2008) Webometric ranking of world universities: Introduction, methodology, and future developments Higher Education in Europe, 33, 233-244 https://doi.org/10.1080/03797720802254031.
, , (2021) Analysis of key factors of influence on scientometric indicators of higher educational institutions of Ukraine International Journal of Educational Development, 81, 102330 https://doi.org/10.1016/j.ijedudev.2020.102330.
(2006) The dilemmas of ranking International Higher Education, 42, 2-3 https://doi.org/10.6017/ihe.2006.42.7878.
(2014) Research performance evaluation: Some critical thoughts on standard bibliometric indicators Studies in Higher Education, 39, 1542-1561 https://doi.org/10.1080/03075079.2013.801429.
, , , , , , , (2015, January 1) Proceedings of the New Trends in Networking, Computing, E-learning, Systems Sciences, and Engineering Springer A critical review on world university ranking in terms of top four ranking systems, pp. 559-566, https://doi.org/10.1007/978-3-319-06764-3_72
, , , , (2020) Scopus as a curated, high-quality bibliometric data source for academic research in quantitative science studies Quantitative Science Studies, 1, 377-386 https://doi.org/10.1162/qss_a_00019.
, , , (2013) Rankings and accountability in higher education - Uses and misuses UNESCO An evolving methodology: The Times Higher Education world university rankings, pp. 41-54, https://unesdoc.unesco.org/ark:/48223/pf0000220789
, , , , , , , , (2022) Territorial bias in university rankings: A complex network approach Scientific Reports, 12, 4995 https://doi.org/10.1038/s41598-022-08859-w. Article Id (pmcid)
, , (2010) Should you believe in the Shanghai ranking? Scientometrics, 84, 237-263 https://doi.org/10.1007/s11192-009-0115-x.
, , , (2020) Web of Science as a data source for research on scientific and scholarly activity Quantitative Science Studies, 1, 363-376 https://doi.org/10.1162/qss_a_00018.
Bornmann, L., & Marx, W. (2013). [Proposals for standards for the application of scientometrics in the evaluation of individual scientists in the natural sciences]. Journal of Evaluation, 12(1), 103-127. German. https://www.waxmann.com/artikelART101252
, (1998) The anatomy of a large-scale hypertextual Web search engine Computer Networks and ISDN Systems, 30, 107-117 https://doi.org/10.1016/S0169-7552(98)00110-X.
, , , , , , (2019) Scholarly impact assessment: A survey of citation weighting solutions Scientometrics, 118, 453-478 https://doi.org/10.1007/s11192-018-2973-6.
(2023) Does conflict of interest distort global university rankings? Higher Education, 86, 791-808 https://doi.org/10.1007/s10734-022-00942-5.
, , (2010) Self-citations at the meso and individual levels: Effects of different calculation methods Scientometrics, 82, 517-537 https://doi.org/10.1007/s11192-010-0187-7. Article Id (pmcid)
, , (2010) Uncovering excellence in academic rankings: A closer look at the Shanghai ranking Scientometrics, 83, 515-524 https://doi.org/10.1007/s11192-009-0076-0.
, (2019) A new approach to the analysis and evaluation of the research output of countries and institutions Scientometrics, 119, 1207-1225 https://doi.org/10.1007/s11192-019-03089-w.
(2017) Relative visibility of authors' publications in different information services Scientometrics, 112, 917-925 https://doi.org/10.1007/s11192-017-2416-9.
Dorsch, I., Schlögl, C., Stock, W. G., & Rauch, W. (2017). [Research topics of information science in Düsseldorf and Graz (2010 to 2016)]. Information - Wissenschaft & Praxis, 68(5-6), 320-328. German. https://doi.org/doi:10.1515/iwp-2017-0060
, , , (2020) University rankings: A review of methodological flaws Issues in Educational Research, 30, 79-96 https://www.iier.org.au/iier30/fauzi.pdf.
(2021) Mis-measuring our universities: Why global university rankings don't add up Frontiers in Research Metrics and Analytics, 6, 680023 https://doi.org/10.3389/frma.2021.680023. Article Id (pmcid)
, , , , , , (2010) Self-selected or mandated, open access increases citation impact for higher quality research PLoS One, 5, e13636 https://doi.org/10.1371/journal.pone.0013636. Article Id (pmcid)
(2017) A categorization of arguments for counting methods for publication and citation indicators Journal of Informetrics, 11, 672-684 https://doi.org/10.1016/j.joi.2017.05.009.
(2021) Counting methods introduced into the bibliometric research literature 1970-2018: A review Quantitative Science Studies, 2, 932-975 https://doi.org/10.1162/qss_a_00141.
, , (2017) Suitability of Google Scholar as a source of scientific information and as a source of data for scientific evaluation-Review of the literature Journal of Informetrics, 11, 823-834 https://doi.org/10.1016/j.joi.2017.06.005.
, (2016) Google Scholar, Scopus and the Web of Science: A longitudinal and cross-disciplinary comparison Scientometrics, 106, 787-804 https://doi.org/10.1007/s11192-015-1798-9.
, , (2020) Dimensions: Bringing down barriers between scientometricians and data Quantitative Science Studies, 1, 387-395 https://doi.org/10.1162/qss_a_00020.
, , , , , , , (2015) Coverage of academic citation databases compared with coverage of scientific social media Online Information Review, 39, 255-264 https://doi.org/10.1108/OIR-07-2014-0159.
(2005) An index to quantify an individual's scientific research output Proceedings of the National Academy of Sciences, 102, 16569-16572 https://doi.org/10.1073/pnas.0507655102. Article Id (pmcid)
(2023) Superconductivity, what the H? The emperor has no clothes International Journal of Modern Physics B, 38, 2430001 https://doi.org/10.1142/S0217979224300019.
, (2017) What contributes more to the ranking of higher education institutions? A comparison of three world university rankings International Education Journal: Comparative Perspectives, 16, 29-46 https://openjournals.library.sydney.edu.au/IEJ/article/view/10638.
(2012) Opening the black box of QS world university rankings Research Evaluation, 21, 71-78 https://doi.org/10.1093/reseval/rvr003.
, , , , , , , (2007) International ranking systems for universities and institutions: A critical appraisal BMC Medicine, 5, 30 https://doi.org/10.1186/1741-7015-5-30. Article Id (pmcid)
, , (2021) Do researchers know what the h-index is? And how do they estimate its importance? Scientometrics, 126, 5489-5508 https://doi.org/10.1007/s11192-021-03968-1.
Kladroba, A., Buchmann, T., Friz, K., Lange, M., & Wolf, P. (2021). [Indicators for measuring research, development, and innovation. Profiles with application notes]. Springer Gabler Wiesbaden. German. https://doi.org/10.1007/978-3-658-32886-3
(2024) University rankings in the context of research evaluation: A state-of-the-art review Quantitative Science Studies, 5, 533-555 https://doi.org/10.1162/qss_a_00317.
, (2011) How to evaluate universities in terms of their relative citation impacts: Fractional counting of citations and the normalization of differences among disciplines Journal of the American Society for Information Science and Technology, 62, 1146-1155 https://doi.org/10.1002/asi.21511.
(2018) The building of weak expertise: The work of global university rankers Higher Education, 75, 415-430 https://doi.org/10.1007/s10734-017-0147-8.
, (2005) The academic ranking of world universities Higher Education in Europe, 30, 127-136 https://doi.org/10.1080/03797720500260116.
, , , (2018) Google Scholar, Web of Science, and Scopus: A systematic comparison of citations in 252 subject categories Journal of Informetrics, 12, 1160-1177 https://doi.org/10.1016/j.joi.2018.09.002.
(2005) The malign influence of impact factors Journal of the Royal Society of Medicine, 98, 556 https://doi.org/10.1177/014107680509801221. Article Id (pmcid)
(2017) A critical comparative analysis of five world university rankings Scientometrics, 110, 967-990 https://doi.org/10.1007/s11192-016-2212-y.
, (2016) The journal coverage of Web of Science and Scopus: A comparative analysis Scientometrics, 106, 213-228 https://doi.org/10.1007/s11192-015-1765-5.
Morse, R., & Wellington, S. (2024). How U.S. news calculated the 2024-2025 best global universities rankings. https://www.usnews.com/education/best-global-universities/articles/methodology
, (2017) Is measuring the knowledge creation of universities possible?: A review of university rankings Technological Forecasting and Social Change, 123, 153-160 https://doi.org/10.1016/j.techfore.2016.03.029.
, (2010) Caveats for the journal and field normalizations in the CWTS ("Leiden") evaluations of research performance Journal of Informetrics, 4, 423-430 https://doi.org/10.1016/j.joi.2010.02.003.
, , , , (2018, September 12-14) Proceedings of the 23rd International Conference on Science and Technology Indicators Centre for Science and Technology Studies Taking national language publications into account: The case of the Finnish performance-based research funding system, pp. 204-211, https://scholarlypublications.universiteitleiden.nl/handle/1887/65223
, , , (2017) The need to quantify authors' relative intellectual contributions in a multi-author paper Journal of Informetrics, 11, 275-281 https://doi.org/10.1016/j.joi.2017.01.002.
Reichmann, G., & Schlögl, C. (2021). [Possibilities for influencing the results of a research evaluation]. Information - Wissenschaft & Praxis, 72(4), 212-220. German. https://doi.org/doi:10.1515/iwp-2021-2148
, (2022) On the possibilities of presenting the research performance of an institute over a long period of time: The case of the Institute of Information Science at the University of Graz in Austria Scientometrics, 127, 3193-3223 https://doi.org/10.1007/s11192-022-04377-8.
Reichmann, G., Schlögl, C., Stock, W. G., & Dorsch, I. (2022). [Research evaluation at the department level. The influence of the chosen methodology on the results]. BZH Beiträge zur Hochschulforschung, 44, 74-97. German. https://www.bzh.bayern.de/archiv/artikelarchiv/artikeldetail/forschungsevaluation-auf-institutsebene-der-einfluss-der-gewaehlten-methodik-auf-die-ergebnisse
(2019) Inter-ranking reputational effects: An analysis of the Academic Ranking of World Universities (ARWU) and the Times Higher Education World University Rankings (THE) reputational relationship Scientometrics, 121, 897-915 https://doi.org/10.1007/s11192-019-03214-9.
Schlögl, C. (2013). [International visibility of European and especially German-speaking information science]. Information - Wissenschaft & Praxis, 64(1), 1-8. German. https://doi.org/doi:10.1515/iwp-2013-0001
Schloegl, C., Stock, W. G., Dorsch, I., & Reichmann, G. (2022). Bibliographic dataset about the publications (2009 - 2018) and their Web of Science citations of two university institutes (Department of Information Science at the University of Düsseldorf, Germany, Institute of Information Science and Information Systems at the University of Graz, Austria). https://doi.org/10.5281/zenodo.7263222
Schneijderberg, C. (2017). [Doctoral studies in the social sciences. A socialization-theoretical exploration of the research field of doctoral studies]. Springer VS Wiesbaden. German. https://doi.org/10.1007/978-3-658-19739-1
, , (2006) The weight of author self-citations. A fractional approach to self-citation counting Scientometrics, 67, 503-514 https://doi.org/10.1556/Scient.67.2006.3.11.
(1992) The skewness of science Journal of the American Society for Information Science, 43, 628-638 https://doi.org/10.1002/(SICI)1097-4571(199210)43:9<628::AID-ASI5>3.0.CO;2-0.
(1997) Why the impact factor of journals should not be used for evaluating research BMJ: British Medical Journal, 314, 498-502 http://www.jstor.org/stable/25173791. Article Id (pmcid)
, , , (2020) A longitudinal analysis of university rankings Quantitative Science Studies, 1, 1109-1135 https://doi.org/10.1162/qss_a_00052.
, , (2019) Measuring scientific contributions with modified fractional counting Journal of Informetrics, 13, 679-694 https://doi.org/10.1016/j.joi.2019.03.010.
Stock, W. G. (2001). [Publication and citation: The problematic basis of empirical science research]. Kölner Arbeitspapiere zur Bibliotheks- und Informationswissenschaft, 29, 1-51. German. https://www.deutsche-digitale-bibliothek.de/item/GVQ627RI6IBHMU6PVPHVN2MICBSBZZ6J
Stock, W. G. (2010). [What is a publication? On the problem of unit formation in science studies]. In M. Bonitz, K. Fuchs-Kittowski, S. Greif, F. Havemann, H. Kant, H. Laitko, K. Lüdtke, H. Parthey, W. Stock, W. Umstätter, R. Wagner-Döbler, P. Werner, & R. Zott (Eds.), [Science and Digital Library: Science Research Yearbook 1998]. Humboldt-Universität zu Berlin. German. https://doi.org/10.18452/24807
Stock, W. G. (2022). [Information science research in Düsseldorf (1968 to 2023)]. German. https://doi.org/10.5281/zenodo.7456998
, , , (2023a) Labor productivity, labor impact, and co-authorship of research institutions: Publications and citations per full-time equivalents Scientometrics, 128, 363-377 https://doi.org/10.1007/s11192-022-04582-5.
, , , (2023b) Counting research publications, citations, and topics: A critical assessment of the empirical basis of scientometrics and research evaluation Journal of Information Science Theory and Practice, 11, 37-66 https://doi.org/10.1633/JISTaP.2023.11.2.4.
, (2019) Publishing in English or another language: An inclusive study of scholar's language publication preferences in the natural, social and interdisciplinary sciences Scientometrics, 118, 645-652 https://doi.org/10.1007/s11192-018-2987-0.
, (2017) The research production of nations and departments: A statistical model for the share of publications Journal of Informetrics, 11, 1142-1157 https://doi.org/10.1016/j.joi.2017.10.001.
, , , (2003) Using publications counts to measure an institution's research productivity Research in Higher Education, 44, 121-148 https://doi.org/10.1023/A:1022070227966.
(2016) The non-trivial effects of trivial errors in scientific communication and evaluation Verlag Werner Hülsbusch https://www.vwh-verlag.de/vwh/wp-content/uploads/2016/08/titelei_tuur-frohlich.pdf
(2010) Metrics: A profusion of measures Nature, 465, 864-866 https://doi.org/10.1038/465864a.
(2005) Fatal attraction: Conceptual and methodological problems in the ranking of universities by bibliometric methods Scientometrics, 62, 133-143 https://doi.org/10.1007/s11192-005-0008-6.
, , , , (2010) Rivals for the crown: Reply to Opthof and Leydesdorff Journal of Informetrics, 4, 431-435 https://doi.org/10.1016/j.joi.2010.03.008.
(2018) Fair ranking of researchers and research teams PLoS One, 13, e0195509 https://doi.org/10.1371/journal.pone.0195509. Article Id (pmcid)
, (2006) Use of bibliometric information to assist research policy making. A comparison of publication and citation profiles of full and associate professors at a school of chemistry in Uruguay Scientometrics, 69, 287-313 https://doi.org/10.1007/s11192-006-0154-5.
, , (2019) Web of Science and Scopus language coverage Scientometrics, 121, 1803-1813 https://doi.org/10.1007/s11192-019-03264-z.
, , (2018) Are university rankings useful to improve research? A systematic review PLoS One, 13, e0193762 https://doi.org/10.1371/journal.pone.0193762. Article Id (pmcid)
(2013) Citation time window choice for research impact evaluation Scientometrics, 94, 851-872 https://doi.org/10.1007/s11192-012-0775-9.
, (2020) Improving the reliability of short-term citation impact indicators by taking into account the correlation between short- and long-term citation impact Journal of Informetrics, 14, 101019 https://doi.org/10.1016/j.joi.2020.101019.
(2016) A review of the literature on citation impact indicators Journal of Informetrics, 10, 365-391 https://doi.org/10.1016/j.joi.2016.02.007.
, , , , , , , , , (2012) The Leiden ranking 2011/2012: Data collection, indicators, and interpretation Journal of the American Society for Information Science and Technology, 63, 2419-2432 https://doi.org/10.1002/asi.22708.
(2002) Visibility of research: FUTON bias The Lancet, 360, 1256 https://doi.org/10.1016/S0140-6736(02)11264-5.
Wittgenstein, L. (n.d.). [Logico-philosophicus tractatus]. Latin. https://wittgensteinproject.org/w/index.php/Tractatus_Logico-Philosophicus_(English)
, (2018) Quantifying quality: Research performance evaluation in Korean universities Journal of Information Science Theory and Practice, 6, 45-60 https://doi.org/10.1633/JISTaP.2018.6.3.5.
, (2013) Bibliometric approach to research assessment: Publication count, citation count, & author rank Journal of Information Science Theory and Practice, 1, 27-41 https://doi.org/10.1633/JISTaP.2013.1.1.2.
- Received
- 2024-10-29
- Revised
- 2025-01-27
- Accepted
- 2025-04-03
- Published
- 2025-06-30
- Downloaded
- Viewed
- 0KCI Citations
- 0WOS Citations