

JOURNAL OF INFORMATION SCIENCE THEORY AND PRACTICE
- P-ISSN2287-9099
- E-ISSN2287-4577
- SCOPUS, KCI

Does it Matter? A Reflection from Network Analysis of the Voice of Library Users


Nawapon Kaewsuwan (Faculty of Humanities and Social Sciences, Prince of Songkla University, Pattani, Thailand)
Wannisa Matcha (Faculty of Communication Sciences, Prince of Songkla University, Pattani, Thailand)
Komgrit Rumdon (John F. Kennedy Library, Office of Academic Resources, Prince of Songkla University, Pattani, Thailand)
Prin Khwanriang (Faculty of Humanities and Social Sciences, Thaksin University, Songkhla, Thailand)
Thanidaphat Saengthong (Faculty of Humanities and Social Sciences, Prince of Songkla University, Pattani, Thailand)

Abstract
This study examines key factors influencing university library users’ experiences. User-generated comments (UGCs) were determined as the source of the users’ feedback. UGCs were collected from four Thai university libraries from 2022 to 2024, totaling 983 comments. After text cleaning (removing special characters, emojis, and URLs), 960 UGCs were obtained for analysis. The researchers separated the text into sentences and defined types and themes for UGCs. Finally, 1,108 UGCs were used for descriptive analysis and epistemic network analysis, and 196 comments were used for sentiment analysis. It was found that facilities and infrastructure were the most highly mentioned issues. University C’s users showed the highest dissatisfaction regarding basic facility needs. University B’s users emphasized additional resources. Additionally, this study illustrated the importance of service quality and human-centered support. It was revealed that 65.31% of users were positive about the library staff and services. This study suggested that libraries should be flexible, user-friendly, accessible, and attentive by using analytical tools to monitor real-time feedback for effective improvement. Well-managed university libraries should provide physical and digital services while maintaining personalized, responsive, and adaptive practices to support academic activities.
- keywords
- voice of the customer, library service, user complaints and compliments, epistemic network analysis, sentiment analysis
1. INTRODUCTION
The main mission of a university library is to support the university’s activities, for instance, teaching and learning, research, and academic services. Specifically, the library aims to facilitate users’ access to various up-to-date information. Recently, users’ behaviors have changed due to the advancement of technology and the dynamics of society; therefore, the library has to adapt itself to meet new inquiries. Gathering user feedback will be an effective way to enhance the library services, aligning with its users’ needs.
Gathering library user feedback refers to a process of collecting and analyzing users’ needs, expectations, and challenges according to their experiences. Some users who are satisfied with the services tend to show their appreciation; meanwhile, those who are not satisfied with the services tend to give complaints or suggestions. This feedback is considered valuable data for improving the library services. Khaznadar and Ali (2025) mentioned that user satisfaction increased when libraries offered well-designed infrastructure and accessible locations. Similarly, Yaylali-Yildiz et al. (2022) found that a library building’s design could represent human-scale proportions and spatial harmony with surroundings in order to promote accessibility. Further, learning space services help to maintain users’ loyalty (Lacey, 2012).
More studies on user feedback have been in the fields of business, marketing, and service development. For example, Amoozad Mahdiraji et al. (2022) explored the feedback of customers in the automotive industry. Alowad et al. (2021) investigated issues related to access to hospital services and the time that patients spend in emergency rooms, using customer feedback and the voice of the process. Bocskull and Sungtong (2023) proposed a way to gather user feedback to use in a quality assurance system in basic education institutions. The complaint behaviors while using public libraries (Suki, 2010) and academic institution libraries (Oh et al., 2018) have been explored.
The situation of library usage behavior, emphasizing digital information services over in-person library visits, combined with digital communication and feedback, enables libraries to access user opinions and feelings expressed via social media networks, as well as complaints/feedback on digital platforms. This allows libraries to better comprehend customer input than traditional approaches like satisfaction surveys or complaint analysis, which can have constraints in question structure and sample size. Advances in natural language processing (NLP) allow libraries to conduct more in-depth analyses of user opinions and emotions. However, such analysis frequently focuses on categorizing emotions into discrete data units and has limitations in defining the structural links between library experience, library components, and user emotions. In this context, techniques like epistemic network analysis (ENA) are gaining popularity because they can show the relationships between user concepts, experiences, and emotions inside knowledge network structures (Williamson Shaffer & Ruis, 2017). As a result, ENA analyzes data relationships to provide a more systematic and profound understanding of the structure of library user experiences and feelings in a digital environment.
University libraries in Thailand have undergone an innovative transformation era, especially after COVID-19. They shifted to digital platforms to expand library services by allowing users to access resources anywhere and anytime. Nevertheless, current services are provided according to the perspectives of libraries, not users. Employing sentiment analysis on feedback shows great attention to meeting users’ expectations. As a result, this study focuses on analyzing users’ feedback on university libraries with sentiment analysis; thus, practical insights and guidelines for improving university library services are expected.
2. RESEARCH QUESTIONS AND OBJECTIVES
2.1. Research Questions
1) What are the voices of university library users towards library services?
2) Which issues regarding library services receive the most comments from users?
3) What is the structure of the relationship between the types of comments (complaints, suggestions, compliments) and issues related to library services?
4) How do the opinions of library users affiliated with universities in different contexts differ?
2.2. Research Objectives
1) To analyze the voices of university library users using sentiment analysis techniques.
2) To categorize user opinions into complaints, suggestions, and compliments related to library services.
3) To analyze the relationship between library service issues and types of user opinions using epistemological network analysis.
4) To compare the patterns of user opinions and experiences across multiple university libraries to reflect the unique characteristics of different library service models.
3. LITERATURE REVIEW
3.1. Customer Complaints and Compliments
Adeniran (2024) mentioned that user complaints help libraries to learn and respond to concerns promptly. In a sense, studying complaints and compliments is under the concept of the voice of the customer (VOC). This has been applied in business to detail a process of collecting and analyzing customer needs and experiences. VOC is considered an important technique for product and service development. Ulwick (2002) stated that gathering the VOC assists organizations in understanding customers’ perspectives. This helps organizations to enhance the quality of products and services that meet the needs of the customers.
The VOC process usually comprises gathering and analyzing customers’ opinions, expectations, and suggestions for product and service development. To apply the VOC in the context of university libraries, it could contribute to the service quality. Feedback could be gathered from various domains, for instance, surveys or interviews. It may consist of positive and negative feedback. Oh et al. (2018) studied library user complaints and classified them into five main categories: (1) inadequacies in library collections, (2) library environment and facilities (including location, cleanliness, and temperature), (3) service-related issues and procedural errors, (4) staff competence and service attitude, and (5) other miscellaneous issues. Customer complaints are based on dissatisfaction with a product or service. These complaints could be managed with effective methods and turn those users into loyal ones. As highlighted by Schoefer (2008), users who placed complaints potentially return to use the services if the complaints were resolved effectively. Further, negative word-of-mouth actions, including online complaints, have been commonly seen due to convenient accessibility and low cost. Online responses can influence some users’ decision-making in choosing a product or service. On the other hand, compliments refer to positive evaluation and intend to create an impression and satisfaction.
Positive and negative feedback provides fruitful insights regarding users’ perceptions of using library services. Adeniran (2024) said that to reach the highest level of user satisfaction, continuous service quality improvement is essential. Systematic complaint management may foster user loyalty and service utilization. By the same token, Reyes (2019) stated that it was important to conduct regular user satisfaction assessments and implement complaint management. A standardized, timely, and professional system for managing complaints was employed to enhance user satisfaction and institutional credibility (Reyes, 2019). Furthermore, according to Reyes (2019), user complaints should be considered as positive feedback since those were for improvement, not criticisms.
All in all, customer complaints and compliments are important indicators of service quality, showing strengths and weaknesses. These could contribute to improving overall service quality; hence, having the VOC as the main channel for gathering library user feedback is essential. Feedback tends to provide guidelines for additional service improvement of university libraries. However, when feedback is collected on a large scale, particularly through online platforms, manual interpretation becomes challenging. Therefore, systematic analytical approaches are required to interpret large volumes of user feedback and uncover patterns in user experiences. One such approach is sentiment analysis, which enables the identification of emotional orientations expressed in user comments.
3.2. Sentiment Analysis
Sentiment analysis, also referred to as opinion mining, is a computational technique to identify, extract, and evaluate information expressed in text form. It involves the NLP concept, computational linguistics, and text analytics to categorize attitudes as follows: positive, negative, or neutral. The technique has been applied in social media comments, emails, and customer conversation records, where organizations analyze and interpret data to develop or improve their products or services. Sentiment analysis implementation may involve lexicon-based approaches, rule-based models, or machine learning algorithms (Nawaz, 2023).
Sentiment analysis provides a systematic way to capture the affective dimension from the VOC. As mentioned, the VOC captures the experiences of the users. Using sentiment analysis enables us to reveal how users emotionally evaluate services and interactions. By analyzing the emotional tone embedded in user comments, organizations can better understand satisfaction, frustration, and appreciation related to different service components.
Sentiment analysis has been applied in several studies examining library services. For example, Ning (2025) implemented a visual feedback method called photovoice to investigate how university libraries in Hong Kong assist the cultural adjustment of mainland Chinese students and their emotional engagement with library spaces. It revealed that students were satisfied with libraries’ services in terms of privacy and freedom, helping them ease feelings of loneliness and discomfort in public spaces. However, students’ strong emotional attachment intensified academic stress and anxiety from time to time. The study emphasizes the importance of acknowledging the emotional and psychological dimensions of library use and providing helpful tips for developing policies that enhance cross-cultural adaptation among international students.
Similarly, Guo et al. (2024) gathered data from Dianping.com to identify pain points for 20 Chinese public libraries by employing a sentiment lexicon to classify user feedback. The results reported 84% of users’ satisfaction regarding the services provided, while negative comments mostly concerned issues related to noise levels, seating availability, and service quality. The sentiments were grouped into six domains: user services, spatial experiences, library location, information resources, facilities, and librarian support. This study shows how sentiment analysis can classify specific service areas requiring improvement to respond to user expectations.
Additionally, sentiment analysis can also inform strategic library management decisions. As suggested by Papachristopoulos et al. (2019), libraries could make use of sentiment analysis to better understand and respond to user preferences and expectations. Moreover, Nurmalasari et al. (2024) assess sentiment classification accuracy from student and faculty feedback at Politeknik Caltex Riau from 2018 to 2023 using the Valence Aware Dictionary and sEntiment Reasoner sentiment analysis tool combined with tokenization, filtering techniques, Naïve Bayes, support vector machine, and Random Forest. It was found that there was high overall user satisfaction, including positive sentiments regarding comfort and accessibility, and negative sentiments in terms of Wi-Fi speed, collection adequacy, and facility maintenance. The findings illustrate the use of sentiment analysis as evidence for improvements in library services through large-scale data.
Even though sentiment analysis is capable of identifying emotional issues, it may overlook the relationships between different aspects of the user experience, such as how complaints about facilities relate to staff interactions or service processes. Therefore, complementary analytical approaches are needed to explore how different themes within user feedback are interconnected. One such approach is ENA.
3.3. Epistemic Network Analysis
ENA refers to a contemporary analytic technique to model and quantify relationships among coded data. More importantly, text or discourse data is coded into meaningful categories, and ENA shows the same patterns of the codes of the whole structure. Each node represents a specific theme, representing the frequency of the theme’s occurrence. ENA illustrates how constructs are connected within a dataset. Previous studies showed ENA’s effectiveness in interpreting learning behaviors. Zörgő and Peters’ (2022) study also examined the interaction patterns and communication dynamics of students. One of the key features is constructing a network model within a shared space. The shared space enables researchers to compare network structures and assess the differences in patterns. Further, researchers can revisit the original data linked to each connection, which shows interpretive depth and analytical transparency.
ENA may be useful in analyzing conversational and collaborative data. For instance, Csanadi et al. (2018) applied ENA to explore problem-solving strategies. It revealed that there were differences in how participants coordinated and shared knowledge. In addition, Yan et al. (2022) employed ENA to model relationships among activities, including key learning tasks, to indicate patterns of teamwork associated with distinct performance outcomes. Moreover, ENA has been integrated with NLP to analyze student conversations across various domains. This integration leverages the ability to gather cognitive and interactional processes in a large dataset.
Despite its growing application in learning analytics and discourse analysis, the use of ENA for analyzing library user feedback remains limited. Within the VOC framework, ENA offers a way to examine how different aspects of library services relate to one another, such as facilities, staff interactions, and service quality. These aspects are often discussed together in user comments. By modeling relationships among feedback themes and comment types, ENA provides a relational perspective on user experiences within the broader library service ecosystem. This approach complements sentiment analysis by revealing how different components of user feedback interact within the discourse of library users.
4. RESEARCH METHODOLOGY
4.1. Data
The data were collected from the library Facebook page posts of four main Thai university libraries from 2022 to 2024. The universities are in different parts of the country and are anonymized as University A to D, as shown in Table 1.
Table 1
Count of comments of library users (own data description)
|
University library |
Data source |
Count of comments |
|
University A |
Library’s VOC system (university’s self-managed system) |
530 |
|
University B |
Library’s VOC system (university’s self-managed system) |
179 |
|
University C |
Library’s VOC system (university’s self-managed system) |
110 |
|
University D |
Library’s VOC system (university’s self-managed system) and Facebook fanpage |
164 |
|
Total |
983 |
|
Note: The original raw dataset prior to cleaning.
VOC, voice of the customer.
University A is in the north of Thailand. The university has approximately 5% international students and 4% international staff. The university’s library strategy focuses on digital innovation and services that support academics and research, as well as prioritizing infrastructure development and sustainable environmental management. The university has adopted several management systems, including the library’s VOC system, which gathered 530 user feedback items for analysis.
University B represents a university library located in the capital of Thailand, which is recognized as a leading research institution with about 5% international students and staff. Its main mission is to disseminate documents and research with a commitment to user-centered service. This library has created user experiences through library tours and has established partnerships with neighboring university libraries in Bangkok and the surrounding provinces by sharing library resources. A total of 179 user feedback items were collected through the library’s VOC system.
University C is located in the northeastern region. It is a regional research university with approximately 2.5% international students and 4% international staff. This university library focuses on providing learning spaces for users to generate knowledge and innovation and promote lifelong learning. The library is developing processes to enhance the modernity and accessibility of the library without limits. This involves implementing a user relationship management strategy, focusing on public relations through social media and online services through the library platform. A total of 110 user feedback items were collected from the library’s VOC system.
University D is located in the southern region. It is a regional research university with an important mission to serve a culturally diverse community, including 1.8% international students and 4% international staff. The library focuses on developing a variety of information resources, both physical and digital. The library aims to transform the library space and environment into a learning space, including developing a learning park for users of all ages. The library prioritizes the development of knowledge and digital repositories, resulting in it having the highest number of systems, databases, and repositories among the four institutions studied. A total of 164 comments were initially retrieved from the library’s VOC system and its official Facebook page for analysis.
4.2. Data Analysis
Data cleaning was conducted to remove noise from the initial dataset. This is done by manually reading through all comments and removing comments that were not meaningful or non-classifiable from the dataset, such as symbolic, single-word comments, such as ‘sleepy’ and ‘indifferent.’ The steps for data cleaning are as follows:
1) Data profiling: This involves studying the characteristics of the dataset and identifying potential problems, such as checking for missing values, duplicate data, and the length of complaint messages. Afterward, the researcher filters the data. If a field is found to be empty or lacks sufficient content for analysis, the researcher filters and removes that data from the dataset.
2) Text cleaning: This is done using basic text processing techniques, such as removing special characters, emojis, and URLs from the text, to retain only meaningful content for sentiment analysis. In the data cleaning process, the result is that the total number of comments from library users has decreased to 960 entries.
After data cleaning, duplicate content is removed by using text-based duplicate detection techniques, such as comparing text in the complaint detail field, since users may submit the same complaint multiple times or due to system errors. There are only 196 entries remaining for sentiment analysis (Fig. 1).

After the data cleaning process, researchers worked together to divide the “comments” into “sub-comments” based on the specific issues mentioned to ensure that the labeling was meaningful and clearly reflected the essence of the messages. For example, ‘clean bathroom and cool air conditioning’ was separated into ‘clean bathroom’ and ‘cool air conditioning.’ Following this, two researchers initially independently determined the types of comments and labeled the themes of the comments on the same dataset. The inter-coder reliability value of 92.70% was found, indicating a high level of agreement. For the disagreement comments, an additional researcher was brought in to review, discuss, and jointly decide on the codes until a consensus was reached. This resulted in a final dataset of 1,108 comments for analysis. The comments were classified by their purpose into three types: suggestions, complaints, and compliments. Meanwhile, the themes were categorized based on the topics mentioned by users, including service, facilities, resources, staff, users, activities and events, and building and infrastructure, the details of which are summarized in Table 2.
Table 2
Defining type and theme of comment (own data processing)
|
Labels |
Descriptions |
|
|
Type |
Suggestion |
Users aim to provide a suggestion for further improvement without critiquing the current situation |
|
Complaint |
Users left criticism or grievance comments |
|
|
Compliment |
Users aim to thank or praise the library or reflect on their grateful feelings |
|
|
Theme |
Service |
The comments focused on the services or experiences of receiving the services offered by the library |
|
Facilities |
The comments focused on other utilities and facilities of the library, such as air conditioning and other electronic devices |
|
|
Resource |
The comments focused on the main library resources available in the library, such as books, e-books, multimedia files, etc. |
|
|
Staff |
The comments mentioned library staff, including the librarian, housekeeping, and other service staff |
|
|
User |
The comments mentioned other users who received the library services at the same time |
|
|
Activities and events |
The comments mention activities and events hosted by the library in its space |
|
|
Buildings and infrastructure |
The comments focused on the library’s infrastructure and physical building |
In this study, ENA was employed to analyze data, utilizing the ENA Web Tool (version 1.7.0; University of Wisconsin-Madison, Madison, WI, USA). The ENA algorithm constructs network models by identifying units of analysis, conversion, and code. The unit of analysis was defined as all lines of comments associated with a single university in a given year. Therefore, each analytical unit represented the aggregated set of comments submitted to a particular university library during a specific year (such as University A–2022). The conversations define the boundaries within which coded elements can co-occur. In this study, each individual comment line was treated as a conversational segment within the broader university-year unit. Co-occurrence relationships were therefore constructed by aggregating coded elements across multiple comment lines within the same university-year context. This approach enables ENA to construct how different types of feedback and themes are associated within the broader discourse of a particular library during a given period. Codes were divided into two types, including:
• Types of comments that capture the communicative intent of the feedback. This could be categorized into three types, including suggestions, complaints, and compliments.
• Themes of the comments refer to the service aspect addressed in the content written by library users. These themes include activities and events, buildings and infrastructure, facilities, staff, services, resources, and users.
Although each individual comment was assigned a primary comment type and theme, ENA was used to examine how these coded categories collectively co-occur across the corpus of comments within each university-year unit. Therefore, the analysis focuses not on individual comments but on the broader structure of user feedback within institutional contexts. This approach enables the identification of dominant associations between types of feedback and service aspects across libraries and time periods, providing a relational perspective that complements descriptive cross-tabulation.
The moving window was set to one line, encompassing the current line and no other preceding lines (Siebert-Evenstone et al., 2017). The collecting method employs a binary summation approach as a co-occurrence of a code in each given line. The line is recorded as presence (1) or absence (0) instead of frequency. The networks were standardized to account for variations. Then, dimensionality reduction was performed by singular value decomposition to maximize variance within the dataset in orthogonal dimensions, as can be observed in Williamson Shaffer and Ruis (2017) and Fang et al. (2024).
The developed structure is portrayed by a network graph, with nodes representing individual codes and edges representing the relative frequency of co-occurrence between codes. Each unit is categorized into two coordinated visual components: (1) plotted points in a reduced-dimensional space, referring to the overall location of the unit’s network, and (2) a weighted network graph, indicating the co-occurrence relationship between codes. The spatial location of network graph nodes is identified by an optimization procedure that is designed to minimize the discrepancy between the plotted points and the corresponding network center.
Besides using ENA, sentiment analysis of the comments was conducted using the Naive Bayes classifier. To analyze the data, the procedures proposed by Kewsuwun and Kajornkasirat (2022) were adopted (Fig. 2). This process involved locating data, gathering it, choosing it, cleaning it, classifying it, and presenting the findings.
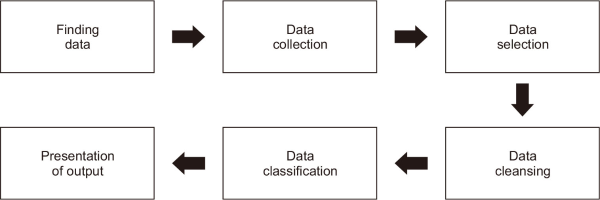
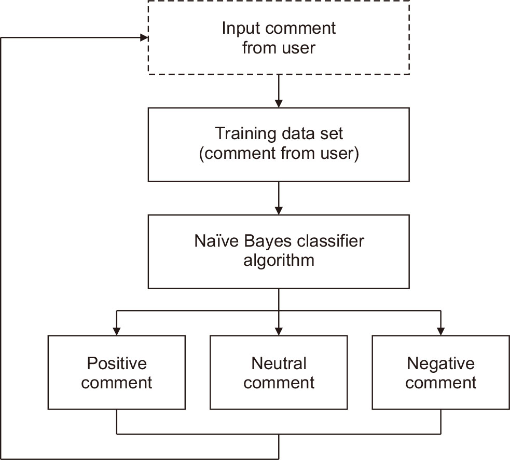
Steps 1 and 3 were performed as presented earlier. However, in the data cleansing process, additional removal was done. This includes deletion of comments that were redundant, irrelevant, and incomplete. Additional comments that included publishing images, tagging other people’s names, responding with emoticons, being difficult to understand, or using any language other than Thai were all removed. As a result, only 196 comments remained after cleaning. Then, a data classification was performed to analyze and gather opinions in Thai. This step began with the separation of data into training and test cases to teach the algorithm to learn the comments. The dataset was trained using the Naive Bayes classifier technique by using a library for sentiment analysis in Python from Bromberg and Lima (2013) (Fig. 3).
The process of data cleaning for sentiment analysis began with a manual review of the dataset. The researcher collected a total of 1,108 user comments and organized them in an Excel file (version Office 365; Microsoft, Madison, WI, USA), categorized by university and comment type. Each comment was first examined, and related data was selected for each university by quick reading. As such, only potentially meaningful user comments were retained for the following analytical step. A comprehensive data cleaning process was then carried out after completion of the initial review to remove redundant and irrelevant data, including, for example, short phrases such as “Buy more books,” “Good,” and “The air-conditioning is cool.” In addition, content that was not related was excluded, such as “555” (a laughing expression in Thai), political references, or incomplete codes, for example, “Buy chairs,” “Thirsty,” “Not fierce,” and “Sullen face.” Furthermore, tagged usernames, image posts, special characters (e.g., “@,” “#,” “^^”), and emoji icons (e.g., “*,” “😝😑🙄😐”) were eliminated so that there was no redundancy or at least the smallest redundancy and minimal errors during sentiment analysis, thereby increasing analytical accuracy. It was found, moreover, that many users’ symbols or expressions were ambiguous or even contrary to the contents in their texts—e.g., a comment that contained a positive idea was accompanied by emojis that expressed negative emotions.
Following the data cleaning process, there were only 196 comments remaining in the dataset, which was suitable for sentiment analysis. Cross-checking was done with the comment types and university categories to verify and ensure the accuracy of data classification and consistency. Next, the researcher analyzed the now clean dataset by using a Naive Bayes classification algorithm for binary sentiment analysis in Python, based on the approach by Bromberg and Lima (2013). Consequently, the Thai-language user comments could possibly be systematically analyzed and interpreted. The final step was to design the results in absolute numbers and percentages by classifying them into positive and negative sentiments. This structured presentation allowed for clearer interpretation and facilitated comparison across different universities.
The results of the classification process are presented in two formats: 1) display the number counts and percentages of positive, neutral, and negative comments, and 2) present the top three positive, neutral, and negative results based on keyword search (Fig. 3).
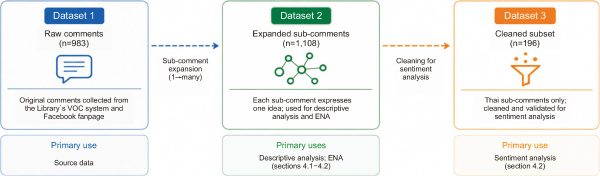
To summarize the overall picture of data analysis and datasets used in this study, Fig. 4 presents data-processing pipelines and the three analytical datasets used in this study. Dataset 1 shows the original raw comments (n=983). To examine the institution-level using ENA, the dataset was expanded with sub-comments. Therefore, dataset 2 was expanded to 1,108 comments. The descriptive analysis and ENA were analyzed using this dataset as presented in Sections 4.1-4.2. Due to the standard process of using sentiment analysis, the dataset underwent a further cleaning process. As a result, dataset 3 was reduced to 196 comments. This result was presented in Section 4.2.
Fig. 4
Data processing pipeline (own data processing). VOC, voice of the customer; ENA, epistemic network analysis.
5. RESULTS
5.1. General Information About Comments from Library Users
After data processing, there were a total of 1,108 comments (refer to dataset 2) from library users used in this analysis. When classified by year, 2023 had the highest count of comments with 492 comments (44.40%), followed by 2022 with 344 comments (31.04%), and 2024 with 272 comments (24.56%).
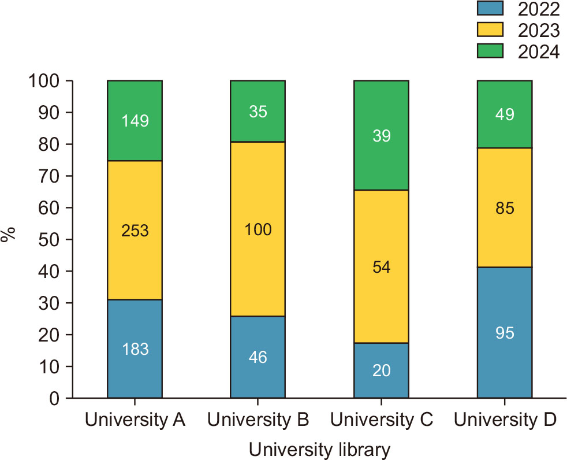
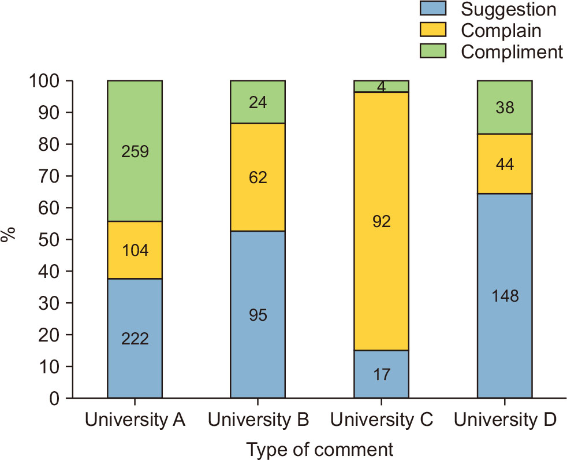
When divided based on universities (Fig. 5), it can be seen that University A had the highest frequency of comments, containing 585 comments (52.80%), followed by University D with 229 comments (20.66%), University B with 181 comments (16.34%), and University C with 113 comments (10.20%). When separated by year, University A had the highest number of comments in 2022, with 183 comments, followed by University D, Library B, and University C (95, 46, and 20 comments), respectively. University A had the highest number of comments in 2023, with 253 comments, followed by University B, University D, and University C (100, 85, and 54 comments), respectively. University A had the highest count of comments in 2024 with 149 comments, followed by University D, University C, and University B (49, 39, and 35 comments), respectively. Based on these comments, ‘Suggestion comment’ had the highest number of comments, containing 482 comments (43.46%), followed by ‘Compliment comment’ with 325 comments (29.33%) and ‘Complain comment’ with 302 comments (27.26%), respectively. University A has the highest count of the type of ‘Suggestion comment’ with 222 comments, followed by University D, University B, and University C (148, 95, and 17 comments), respectively. University A has the largest count of the type of ‘Complain comment’ with 104 comments, followed by University C, University B, and University D (92, 62, and 44 comments), respectively. University A has the highest count of the type of ‘Compliment comment’ with 259 comments, followed by University D, University B, and University C (38, 24, and 4 comments), respectively (Fig. 6).
When explored based on the theme of comments, ‘Service’ had the most comments with 314 comments (28.31%), followed by ‘Buildings and Infrastructure’ with 246 comments (22.18%), ‘Facilities’ with 233 comments (21.01%), ‘Resources’ with 167 comments (15.07%), ‘Staff’ with 97 comments (8.75%), ‘User’ with 39 comments (3.52%), and ‘Activities and Events’ with 13 comments (1.17%). University A has the largest count of the theme of ‘Service’ with 217 comments, followed by University D, University B, and University C (46, 32, and 19 comments), respectively. University A has the largest count of the theme of ‘Buildings and Infrastructure’ with 151 comments, followed by University D, University B, and University C (51, 33, and 11 comments), respectively (Fig. 7).
Fig. 7
Number of comments in each classified theme based on university libraries (own data processing).
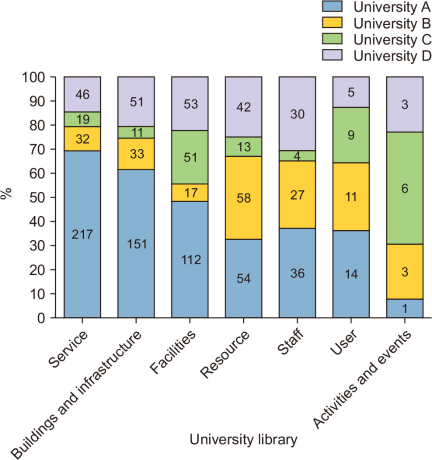
University A has the largest count of the theme of ‘Facilities’ with 112 comments, followed by University D, University C, and University B (53, 51, and 17 comments), respectively. University B has the largest count of the theme of ‘Resources’ with 58 comments, followed by University A, University D, and University C (54, 42, and 13 comments), respectively. University A has the largest count of the theme of ‘Staff’ with 36 comments, followed by University D, University B, and University C (30, 27, and 4 comments), respectively. University A has the largest count of the theme of ‘User’ with 14 comments, followed by University B, University C, and University D (11, 9, and 5 comments), respectively. University C has the largest count of the theme of ‘Activities and Events’ with 6 comments, followed by University D, University B, and University A (3, 3, and 1 comments).
5.2. Connection Between Comment Types and Theme
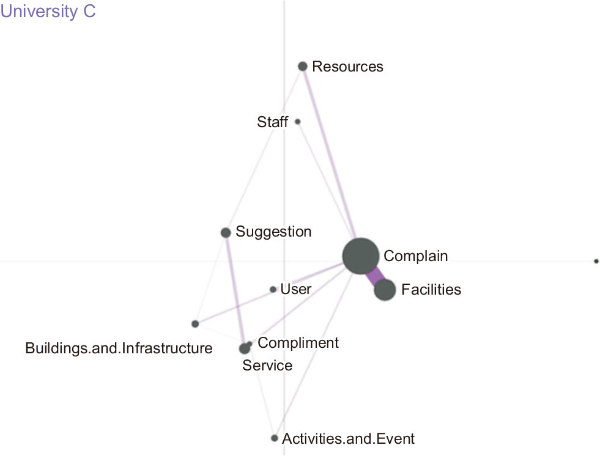
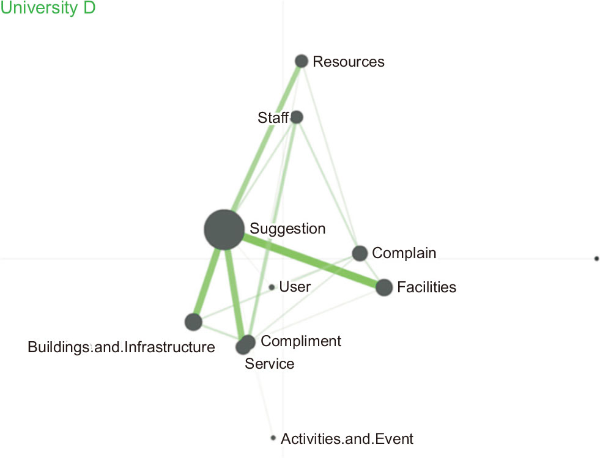
ENA was constructed using dataset 2 to explore how the type and theme of the comments interconnected. ENA models present the co-occurrence of coded discourse elements, in this case, the type and theme of the comments. The nodes in the network represent different discourse elements, including Suggestion, Complaint, Compliment, Facilities, Buildings and Infrastructure, Staff, Service, Resources, User, and Activities and Events. The edges connecting the nodes indicate relationships between these codes, with thicker edges signifying stronger associations in the dataset.
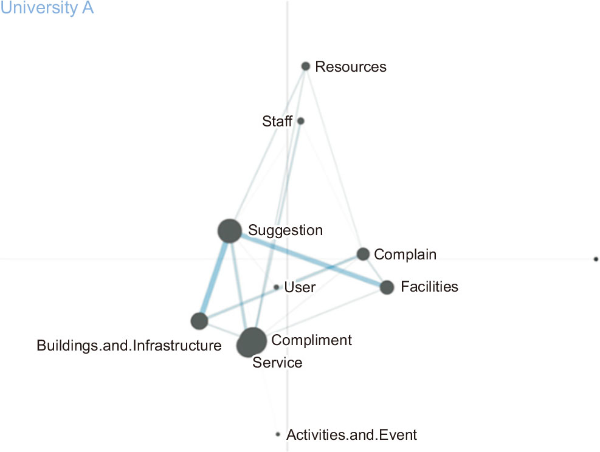
In The ENA network of University A, Fig. 8 reveals strong connections between ‘Suggestion’ and ‘Facilities’ and ‘Suggestion’ and ‘Buildings and Infrastructure.’ The examples of the comments include “I would like there to be more parking spaces,” “I would like clearer signage indicating the locations of rooms,” and “If the university could expand the service areas by adding more workshop-like spaces, it would be more beneficial for students in practice-based programs.” This suggested that library users at University A frequently provided feedback on infrastructure and its facility-related improvements, often in a positive light, such as “I would like to have beds or sleeping mats available,” “I would like the Internet to be more stable,” “I would like more power strips and headphones provided,” and “I would like the computers to operate faster and not be so slow.” Additionally, there is a moderate connection between ‘Suggestion’ and ‘Services,’ indicating users’ concerns about available services. The connections between ‘Complaint’ and ‘Buildings and Infrastructure,’ as well as ‘Facilities,’ were weaker than what was suggested. This showed that library users who visit University A had fewer complaints related to library facilities. They were likely to be satisfied with the library.
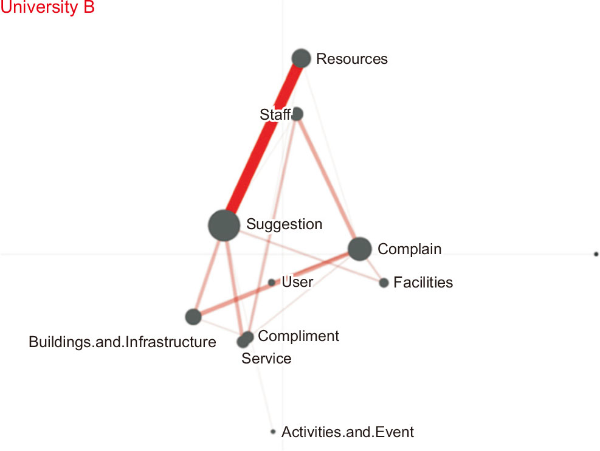
In contrast to University A’s ENA network, University B library users were more likely to provide suggestions on the resources (Fig. 9). A distinctly strong connection between ‘Suggestion’ and ‘Resources’ was clearly projected. The thick linkage between these two nodes suggested that library users at University B tend to suggest and request additional resources for library usage. The most frequently observed comments were book requests as well as online library or journal subscription requests, such as “If the library could purchase the Web of Science database, it would greatly facilitate students’ ease of retrieving information,” “I would like the library to have comic books, manga, and other rare foreign language books, such as Khmer and Mon,” and “I would like the library to have more complete coverage of certain databases, such as PubMed.” The other observable connection was ‘Complaint,’ which linked to ‘Buildings and Infrastructure’ and ‘Staff,’ indicating that users acknowledge the need for improvements to the library’s physical infrastructure and staff.
In University C library users’ comments (Fig. 10) the ENA space showed the most significant connection between ‘Complaint’ and ‘Facilities,’ suggesting that users frequently expressed dissatisfaction with the state of library facilities: for example, “Many of the power outlets are not working,” “There are not enough seats. Please consider extending 24-hour service on the first floor,” “The member system has issues; logging in with SSO results in an error,” and “Many of the chairs are damaged.” Another notable connection was ‘Complaint’ and ‘Resource.’ This connection was based on users’ discontent with the available resources. The relatively weak connection between ‘Suggestion’ and ‘Service’ implies fewer service-related recommendations from users compared to other universities.
In the ENA model for University D users’ comments (Fig. 11), the largest observable node was ‘Suggestion,’ suggesting that this category had the highest frequency of occurrence or connectivity within the dataset. The boldest connections were observed between i) ‘Suggestion’ and ‘Facilities’; ii) ‘Suggestion’ and ‘Resources’; as well as iii) ‘Suggestion’ and ‘Buildings and Infrastructure,’ indicating a strong co-occurrence pattern. This implied that comments frequently linked suggestions with these three aspects (‘Facilities,’ ‘Resources,’ and ‘Building and Infrastructures’), such as “I would like the Internet to be faster and not disconnect or lag frequently,” “I would like more power outlets in various areas. Nowadays, having outlets available for charging different devices is quite important for users and helps increase user satisfaction with the library,” and “Add lighting above shelves, bookcases, and reading tables, and install pull cords to turn the lights on and off to save energy.” Additionally, connections between ‘Staff’ and ‘Compliment’ are also relatively strong. Much thinner lines were visibly rooted from ‘Complaint.’ This indicates that there were a much smaller number of complaints compared to the number of compliments or suggestions.
5.3. Emotion of the Comments Based on Sentiment Analysis
A total of 196 comments (refer to dataset 3) were included in the sentiment analysis process. The data has been cleaned and classified by using Naïve Bayes. The result of this classification is shown in Table 3. There were 128 positive comments (65.31%), 24 neutral comments (12.24%), and 44 negative comments (22.45%), respectively. Some examples of the positive text found in the dataset were ‘very good service (บริการดีมาก),’ ‘good service staff (บุคลากรบริการดี),’ and ‘good suggestion (แนะนำดีมาก)’; some examples of neutral comments were ‘want to have (อยากให้มี),’ ‘sufficient for needs (เพียงพอต่อความต้องการ),’ and ‘please consider (ฝากพิจารณา)’; and negative comments were ‘not satisfied (ไม่พอใจ),’ ‘disturbing warning sound (เสียงเตือนรบกวน),’ and ‘negligent (เพิกเฉย).’
Table 3
Sentiment analysis from library users (own data processing)
|
University library |
Count of comments |
Positive comments |
Neutral comments |
Negative comments |
|
University A |
104 |
67 |
12 |
25 |
|
University B |
27 |
20 |
3 |
4 |
|
University C |
19 |
13 |
3 |
3 |
|
University D |
46 |
28 |
6 |
12 |
|
Total |
196 (100%) |
128 (65.31%) |
24 (12.24%) |
44 (22.45%) |
Table 4 indicates that Bromberg and Lima (2013) achieve the best overall performance, with the highest F-measure (81.20%) and accuracy (80.00%). Hasko-Nagy (2017) attains the highest precision (88.10%) but has lower recall and accuracy, suggesting that more true cases are missed. Nielsen (2015) shows a comparable F-measure (80.20%) yet lower accuracy (71.30%). Overall, Bromberg and Lima (2013) provide the most balanced performance.
6. DISCUSSION
6.1. General Information about Comments from Library Users
From Objective 1, which aimed to analyze the voices of library users, the results showed that the facilities and their infrastructure issues remain a critical point from the user’s perspective. This is reflected by University A and University D users who focused on providing feedback regarding the facilities and infrastructure of the library. According to the two universities, facilities and library infrastructure included equipment for usage, physical spaces, areas for activities and reading, and restrooms, as well as the quality of service provided by staff or librarians, i.e., guidance, care, and assistance. From the analysis results, it was shown that users believe the library’s facilities are important and are points of interest; their decision to use the library services depends on this factor. It can be said that the length of period users spend in the library was influenced by comfort and convenience factors such as cleanliness, quietness, lighting, suitable chairs and tables, and an efficient Internet signal. This agrees with Shill and Tonner (2003), who reported that facilitating equipment and stuff in library infrastructure significantly affects user numbers, particularly study rooms, quiet zones, comfort, environment, availability of power outlets, and Internet access. Despite the growing trend of online learning among student library users, enhanced physical surroundings continue to motivate most students to allocate more time to study at the library rather than at home or in their dormitories.
The results derived from University B had a distinctive pattern. University B is located in the capital city of Thailand, unlike other universities, which are considered regional universities. A high number of comments suggested and recommended additional procurement of book-type information resources. This might be because University B’s policy is to promote by providing a diverse range of information resources. Hence, it opens the floor for users to recommend additional resources. However, this does not mean that facilities are unimportant. The result might be because University B already has high standards and access to modern technology, resulting in much fewer complaints regarding facilities and infrastructure. This suggested that the basic infrastructure and facilities of University B may already meet fundamental needs, such as comfort, a sense of safety, and responsiveness to usage. In other words, users do not feel the need to suggest or criticize in this area. It could mean that University B has designed its spaces, services, and library structures to such a high standard that there is no room for criticism in this aspect. Nevertheless, more profound study showed that University B already has a diverse information system and collection, while users continue to give feedback for additional information resources. It can be said that users have a higher demand for specialized resources. They may possibly want the library to provide more personalized services, notwithstanding the fact that there are already a variety of resources. This correlates with Shill and Tonner (2003), who pointed out that when a library’s infrastructure and facilities have become standardized, users will otherwise suggest more resources and content quality. Furthermore, users’ complaints about facilities can be reduced when university library spaces are well designed and promote strong engagement (Khademizadeh & Venkatesha, 2014). Hence, University B should consider management of resources to improve services for special sub-groups, e.g., by providing more interdisciplinary books, foreign language books, or resources that serve specific curricula. The library should, in addition, carry out in-depth surveys or focus groups to check users’ satisfaction with noise levels, lighting, safety, or privacy, even in the absence of initial complaints.
In the case of University C, the analysis showed that most users complained about facilities, which is the major issue of the University C library. That reflects that the users’ expectations have not yet been met in terms of physical aspects, and this may reduce the actual user experience (Dean, 2023), even though the library has good information resources (Hardin, 2025).
6.2. Connection Between Comment Types and Theme
From the overall analysis results, it was found that ‘facilities’ are the most frequently mentioned issue in several universities, such as University A and University D, which have suggestions for facility improvements. Meanwhile, University C is associated with complaints. This may be because ‘facilities’ are a significant focus for users and influence their decision to spend time in the library, whether it be regarding ‘number of seats,’ ‘quiet areas,’ ‘adequate lighting,’ ‘signal network,’ or appropriate temperature.’ These are all environmental factors that users can immediately feel and experience while using the service, and they directly affect the duration of time users decide to spend in the library. In other words, if the library has complete facilities, users will spend more time there and are likely to return. In summary, facilities are a key indicator that users use to assess the quality of the library. An investigation by Oh et al. (2018) analyzes customer complaints and examines user reviews of the library. From the analysis, six primary categories of complaints were demonstrated: failure of collections to meet user needs, library services not being consistent with the service environment, librarians’ proficiency and service-mindedness, inadequacies in the environment and facilities (e.g., location, cleanliness, or temperature), library services associated with service errors, and miscellaneous issues. The complaints reflected impacts on amenities’ utilization, users’ happiness, and users’ favorable impression. Further, users’ dissatisfaction may relate to the library’s environment and amenities because they influenced a high degree of service utilization and user loyalty. This finding agrees with the research conducted by Khaznadar and Ali (2025), as user satisfaction increased if the library was well-structured, appropriately situated, and accessible. The architectural design of a library must correspond to human physical capabilities, for proper environments can enable the formation of a learning society that facilitates mutual knowledge exchange. When time passes, decent environments may form a center for creativity or intellectual progress, fostering innovators and enhancing academic performance in higher academic institutions (Yaylali-Yildiz et al., 2022). In this new learning age, apart from being an information resource, a library has transformed its roles into an academy of contemporary knowledge (Matthews, 2005). Provided that users’ needs are fulfilled, any place, such as cafes, co-working spaces, or even their own homes/dormitories, can be chosen instead of a library. This finding addresses the second research objective by identifying the types of feedback that users provide and highlighting areas where service improvements may be required.
As far as the library service models are concerned, it can be gathered that each university focuses on different service models based on the management strategies and approaches of the university and library. This study indicated that each university library has a clearly different service model, which not only depends on the budget or the size of the university but also on the university-level strategies and the specific management methods of each library. The university’s strategy influences the library’s service objectives. For example, University B focuses on international-level research to emphasize deploying its library as a center with multiple information resources, database accessibility, specialized information resources, and online services. University D, which is a university with many campuses, focuses on comprehensive services, accenting shared digital information resources and flexibility in accordance with its local contexts. It was revealed that library management is significant. Though some libraries emphasize physical space enhancement, others may focus on digital services: self-check, Online Public Access Catalog, and virtuality. These varieties reflect the prioritization of each institution’s goals and resources. Moreover, the background of library administrators influences the direction of information services, whether in physical or digital formats (Chiware, 2014).
6.3. Emotion of the Comments Based on Sentiment Analysis
When considering the library’s services, it is found that the library continues to focus on providing assistance and supporting the learning of students, staff, and users in various forms. The results of the sentiment analysis revealed that most comments (65.31%) were positive, as respondents showed appreciation towards the services, e.g., ‘very good service,’ ‘good service staff,’ ‘good suggestion,’ and ‘sufficient for needs.’ It can be said that users believed the library truly supports learning. The study results, moreover, reflected that users were satisfied with the quality of services, including personnel, recommendations, and the adequacy of resources in general. This correlates with Mao et al. (2024), who asserted that service models that focus on learning support and assistance from library officers have an impact on users’ attitudes and feelings. In addition, positive attitudes towards library services revolve around personnel, the speed of assistance, and continuous learning support (Guo et al., 2024). Again, librarians’ and officers’ services, assistance, advice, and support indicate a good level of human relationships (human touch), which still remains significant in the digital age. The relationship between librarians and users in the digital era continues to be an important factor in creating service value and reflects a dimension of relationships that technology cannot fully replace in the context of libraries, especially in situations requiring specific information, advanced searches, or specialized academic assistance.
The role of modern librarians has deviated from being an information service officer to an information consultant. Users, in addition to seeking and acquiring information, can obtain high-quality advice. Thus, the highest level of service quality is not only the best infrastructure and facilities but also involves good advisory services, accessible assistance, and the service-mindedness of the staff (Mamta & Kumar, 2024).
Furthermore, sentiment analysis and ENA revealed a relationship between user satisfaction and accessibility to library services, aligning with Objective 3. In the case of University A, a large number of users expressed positive sentiments towards library services, particularly those supporting the university’s internationalization, such as the provision of multilingual resources, English-language library training, and the design of reading spaces that consider users from diverse cultures. These services reflect University A’s institutional context, which prioritizes internationalization policies and has a large proportion of international students, especially from China, Myanmar, and Vietnam. These factors may significantly contribute to positive user perceptions of library accessibility. This finding aligns with previous research indicating that libraries serving diverse user communities tend to adapt their services to accommodate linguistic and cultural differences (Houlihan et al., 2017).
In contrast, thematic structural analysis of University C reveals that users’ perceptions of service quality are linked to library services that align with social contexts or situations, particularly the adjustments to services made during the COVID-19 pandemic. The themes identified by the ENA analysis indicate that mentions of library services are frequently associated with issues related to resource access, continuity of learning, and the institution’s response during periods of discontinuous teaching. This pattern may reflect users’ awareness of the library’s crucial role in maintaining information access and supporting academic activities under crisis constraints. This finding aligns with previous research reporting that many academic libraries expanded their service models during the COVID-19 pandemic by implementing alternative service mechanisms, such as remote borrowing and resource delivery services, to support student continuity of learning (Green, 2022). In summary, these research findings indicate that users’ attitudes towards library services depend not only on the availability of resources but also on the methods or models of service delivery that are appropriate for the user group. This plays a crucial role in creating positive perceptions and engagement between users and library services.
Furthermore, these findings contribute to the fourth research objective, which aims to compare patterns of user opinions and experiences across multiple university libraries. The comparative analysis of the four universities demonstrates distinct patterns of user feedback across institutions. For instance, University B and University D show a relatively high number of suggestions from users. Library users at University B primarily requested additional academic resources, such as books and journals, whereas users at University D provided a wider range of suggestions related to service improvements and infrastructure development. In contrast, comments from University A users mainly focused on facilities, buildings, and infrastructure, while several users at University C expressed dissatisfaction with certain library facilities. These differences reflect the unique service contexts and user expectations of each academic library, reinforcing the importance of considering institutional characteristics when interpreting user feedback and developing service improvement strategies.
7. PRACTICAL IMPLICATIONS
The findings of this study suggest important implications. This includes:
• Service quality development: Flexible, friendly responses, and attentive services were keywords often mentioned by users. The library should ensure that staff and librarians are trained to develop those service skills. However, different groups of users might require different kinds of services; therefore, rather than acting as traditional service providers, librarians might pay attention to the role of advisors, especially for students. The services and roles of librarians should be centered around ‘human’ or library users. One of the most successful examples is Thailand Knowledge Park, also known as Thailand Knowledge Park (2025), which transformed the traditional services from book storage to more dynamic, adaptive, and creative learning hubs. Thailand Knowledge Park restructured their services from book and information providers to facilitators, which received a considerable deal of attention from diverse groups of library users.
• Enhance marketing strategies and user outreach: The findings suggest that the education library might benefit from developing a marketing plan to communicate its services. This might be done by using digital media platforms that are frequently used by target users. This blended platform communication was successfully demonstrated by many libraries. For example, the National Library of Thailand adopted an omni-channel approach, which refers to the use of both online and offline channels to communicate available services and access. The use of omni enables anywhere, anytime access, which creates flexible access for library users. This similar approach is adopted by other universities in Thailand, including Maruey Library, Chiang Mai University Library, Thammasat University Library, and Thaksin University Library. They transformed their libraries into community hubs that serve all groups of people equally. Although different names were used to refer to these community hubs, such as co-working space, learning space, inspiration space, community space, edutainment space, library of life, etc., the underlying idea is to offer a creative and lively learning space to library users and the community.
• Focusing on sustainable infrastructure: The library should consider integrating resource and infrastructure management plans. This includes physical space organization and maintenance, and digital technology utilization by considering library users as the center for this management plan. Among the directions for infrastructure management plans are investments in green libraries and smart libraries. This direction might require the development of digital systems that align with the physical structure. Integrating the digital systems and physical space optimizes the use of library space for future sustainable development.
• Context-specific in-depth study: Future direction also should focus on conducting qualitative and quantitative research to examine how different groups of users interact, value, and have expectations regarding the library services. This is due to the cultural and environmental impact on the users’ expectations of the library. A comparative study of library management would also shed some light on the best practices that inform the improvement of library management and services that would increase users’ satisfaction.
• Utilizing sentiment analysis: The library might consider developing sentiment analysis and automating it for real-time use of this model. Sentiment analysis offers insight into analyzing user feedback, which informs the possible improvement of the digital library services.
8. LIMITATION OF THE STUDY
As highlighted earlier, this study offers several implications. However, some limitations need to be noted. These include:
• Limitations of user opinion data: The data used for analysis may come from online opinion sources or surveys that do not cover all time periods and user groups, especially public opinions, which are often from individuals with extreme experiences (positive or negative). Additionally, the interpretation of sentiment analysis may have limitations in understanding meanings in the Thai context, such as hidden meanings or sarcasm, which automated tools do not yet deeply comprehend.
• Limitations of methodology: While ENA is typically designed to leverage non-exclusive, overlapping codes that co-occur within the same unit of discourse, this study applied mutually exclusive coding. This means that each comment was broken down into smaller sub-units, and each sub-unit was assigned to only one type and one theme. The unit of analysis was, however, defined at the comment level. This decision was made to ensure coding consistency and reduce ambiguity during the annotation process. However, such an approach may constrain ENA’s ability to capture the complex structure of the comments. As a result, the network connections observed in this study may reflect simplified relationships compared to those generated through overlapping coding schemes.
• Limitations of dataset: Even though this study applied a variety of analytical techniques, including descriptive analysis, ENA, and sentiment analysis, each technique required different data pre-processing, which resulted in different numbers of comments included in each result (see Fig. 4). The descriptive and ENA results are based on the expanded sub-comment dataset (n=1,108), whereas the sentiment analysis results are drawn from a substantially smaller and independently cleaned subset (n=196) after removing redundant, incomplete, or non-textual entries. Because these analytical outputs rest on non-identical samples, institution-level patterns observed across sections are not directly comparable; for example, University C contributed 110 raw comments (Table 1) but only 19 comments qualified for sentiment classification (Table 3), limiting the robustness of institution-level sentiment comparisons. Furthermore, the cumulative attrition from 983 raw comments to 196 sentiment-eligible entries may introduce exclusion bias, as short, informal, or emoji-based expressions that may carry genuine sentiment value were removed during the sentiment-specific cleaning phase.
• Differences: This study collected data from four different universities in Thailand. These obviously have impacts from different external factors, such as budget, internal politics, or cultural, environmental, or physical space constraints that are not held as controlled factors in this study. These factors could be significant variables affecting the quality of library services. For instance, language and cultural differences might introduce bias in users’ feedback. For instance, the dataset used in this study was compiled from the official platforms of four university libraries located in different parts of Thailand, i.e., the Central, Northern, Southern, and Northeastern regions. Each region has unique communication norms, dialects, and language expressions. This might impact the sentiment analysis results. For instance, communication norms are different; hence, it might reflect on how users express themselves in their comments and feedback. In some regions, users prefer indirect comments; hence, their tone is a politer critique. Meanwhile, in some parts, users might be more direct; hence, sarcastic tones might be used. This might result in over- or under-representation of negative comments in sentiment analysis. This tone and style of communication pose a challenge for machine learning algorithms, which lack consideration of cultural and other external factors. It is important to note that the sentiment analysis algorithm used in this study was not fine-tuned to any specific regional dialects or cultural expressions. The differences between observations from the four universities might be influenced by these external factors.
• Delimitations: Even though the data was collected from four different universities, the timeline of data collection was maintained in order to delimit the global impacts. Also, the discussion was made by considering the environment and other external impacts.
9. CONCLUSION
This paper presented an analysis of the messages left by library users from four main Thai libraries from 2022 to 2024. The descriptive analysis, ENA, and sentiment analysis were used to understand the users’ comments. By integrating these analytical approaches to analyze the VOC, the study contributes to addressing the limited systematic analysis of large-scale library user feedback. This approach enables a deeper understanding of how users express their experiences, concerns, and expectations regarding library services. The results suggested that users paid much attention to the physical infrastructure, facilities, responsiveness, and attentiveness of librarians and staff, except for University B. The results from University B’s pattern suggested that users tend to look for more resources and more special demand when the basic requirement was met. Besides this, human-centered service remains an important factor that impacts the users’ experience in using the library. That is, the role of the librarian and staff in providing guidelines, support, and willingness to help remains crucial even in digital-based services. Additionally, offering integrated physical and digital services, maintaining user-focused development strategies, and continuing to adapt to the diverse, evolving, and context-specific needs of users are essential to remaining a central and valued part of the potential development of the library.
REFERENCES
Effective complaints management in academic libraries, 2024, http://doi.org/10.2139/ssrn.4989231
, , , , (2021) Enhancing patient flow in emergency department (ED) using lean strategies–an integrated voice of customer and voice of process perspective Business Process Management Journal, 27(1), 75-105, https://doi.org/10.1108/bpmj-11-2019-0457 .
, , , (2022) Analysing the voice of customers by a hybrid fuzzy decision-making approach in a developing country's automotive market Management Decision, 60(2), 399-425, https://doi.org/10.1108/md-12-2019-1732 .
, Sentiment analysis in Python, 2013, https://github.com/abromberg/sentiment_analysis_python
An academic library’s strategic plan in response to institutional goals, 2014, https://www.inasp.info/sites/default/files/2018-04/Aligned%20case%20study.pdf
, , , , (2018) When coding-and-counting is not enough: using epistemic network analysis (ENA) to analyze verbal data in CSCL research International Journal of Computer-Supported Collaborative Learning, 13(4), 419-438, https://doi.org/10.1007/s11412-018-9292-z .
(2023) Some like it quiet: Using a heatmap to study space use in a health sciences library Hypothesis: Research Journal for Health Information Professionals, 35(1), 1-5, https://doi.org/10.18060/25277 .
(2022) Post COVID-19: Expectations for academic library collections, remote work, and resource description and discovery staffing The Journal of Academic Librarianship, 48(4), 102564, https://doi.org/10.1016/j.acalib.2022.102564 .
Sentiment analysis NLTK-ML-LSTM, 2017, https://github.com/nagypeterjob/Sentiment-Analysis-NLTK-ML-LSTM
, , (2017) International students and information literacy: A systematic review Reference Services Review, 45(2), 258-277, https://doi.org/10.1108/rsr-06-2016-0038 .
, (2022) A sentiment analysis model of Agritech startup on Facebook comments using naive Bayes classifier International Journal of Electrical and Computer Engineering (IJECE), 12(3), 2829-2838, https://doi.org/10.11591/ijece.v12i3.pp2829-2838 .
, (2014) A study on user’s opinion about library staff and use of library services in scientific and research institute libraries in Iran Journal of Information and Knowledge, 51(6), 403-409, https://doi.org/10.17821/srels/2014/v51i6/57081 .
, (2025) The impact of academic library location on occupational efficiency: A comparison of the university’s campus design The Journal of Academic Librarianship, 51(6), 103137, https://doi.org/10.1016/j.acalib.2025.103137 .
(2012) How customer voice contributes to stronger service provider relationships Journal of Services Marketing, 26(2), 137-144, https://doi.org/10.1108/08876041211215293 .
, (2024) A systematic review of library service quality studies: Models, dimensions, research populations and methods Journal of Librarianship and Information Science, 56(2), 534-546, https://doi.org/10.1177/09610006221148190 .
, , (2024) Sentiment analysis methods, applications, and challenges: A systematic literature review Journal of King Saud University - Computer and Information Sciences, 36(4), 102048, https://doi.org/10.1016/j.jksuci.2024.102048 .
(2023) A comparative study of machine learning algorithms for sentiment analysis International Journal of Research Publication and Reviews, 4(8), 1999-2003, https://ijrpr.com/uploads/V4ISSUE8/IJRPR16315.pdf .
AFINN sentiment analysis in Python, 2015, https://github.com/fnielsen/afinn
(2025) Let my pictures convey my emotions: Acculturation and place attachment of mainland Chinese students in Hong Kong’s campus libraries Journal of Librarianship and Information Science, 57(2), 418-432, https://doi.org/10.1177/09610006231222629 .
, , , (2024) Discovering user sentiment patterns in libraries with a hybrid machine learning and lexicon-based approach Jurnal Sisfokom (Sistem Informasi dan Komputer), 13(3), 311-317, https://doi.org/10.32736/sisfokom.v13i3.2217 .
(2008) The role of cognition and affect in the formation of customer satisfaction judgements concerning service recovery encounters Journal of Consumer Behaviour, 7(3), 210-221, https://doi.org/10.1002/cb.246 .
, (2003) Creating a better place: Physical improvements in academic libraries, 1995–2002 College & Research Libraries, 64(6), 431-466, https://doi.org/10.5860/crl.64.6.431 .
, , , , , (2017) In search of conversational grain size: Modeling semantic structure using moving stanza windows Journal of Learning Analytics, 4(3), 123-139, https://doi.org/10.18608/jla.2017.43.7 .
(2010) Dissatisfaction attributions and complaining behavior of public library users Information Management and Business Review, 1(1), 28-39, https://doi.org/10.22610/imbr.v1i1.869 .
Thailand Knowledge Park TK Park transforms the library into a fun room, opening a prototype space for modern learning, 2025, https://link.psu.th/NsMYcW
Turn customer input into innovation, 2002, https://hbr.org/2002/01/turn-customer-input-into-innovation
, , (2022) The spatial configuration and publicness of the university campus: Interaction, discovery, and display on De Uithof in Utrecht URBAN DESIGN International, 27(1), 80-94, https://doi.org/10.1057/s41289-020-00130-w .
, (2022) Using the reproducible open coding kit & epistemic network analysis to model qualitative data Health Psychology and Behavioral Medicine, 11(1), 2119144, https://doi.org/10.1080/21642850.2022.2119144 .
- 투고일Received
- 2026-01-27
- 수정일Revised
- 2026-06-23
- 게재확정일Accepted
- 2026-06-25
- 출판일Published
- 2026-09-30
- Downloaded
- Viewed
- 0KCI Citations
- 0WOS Citations